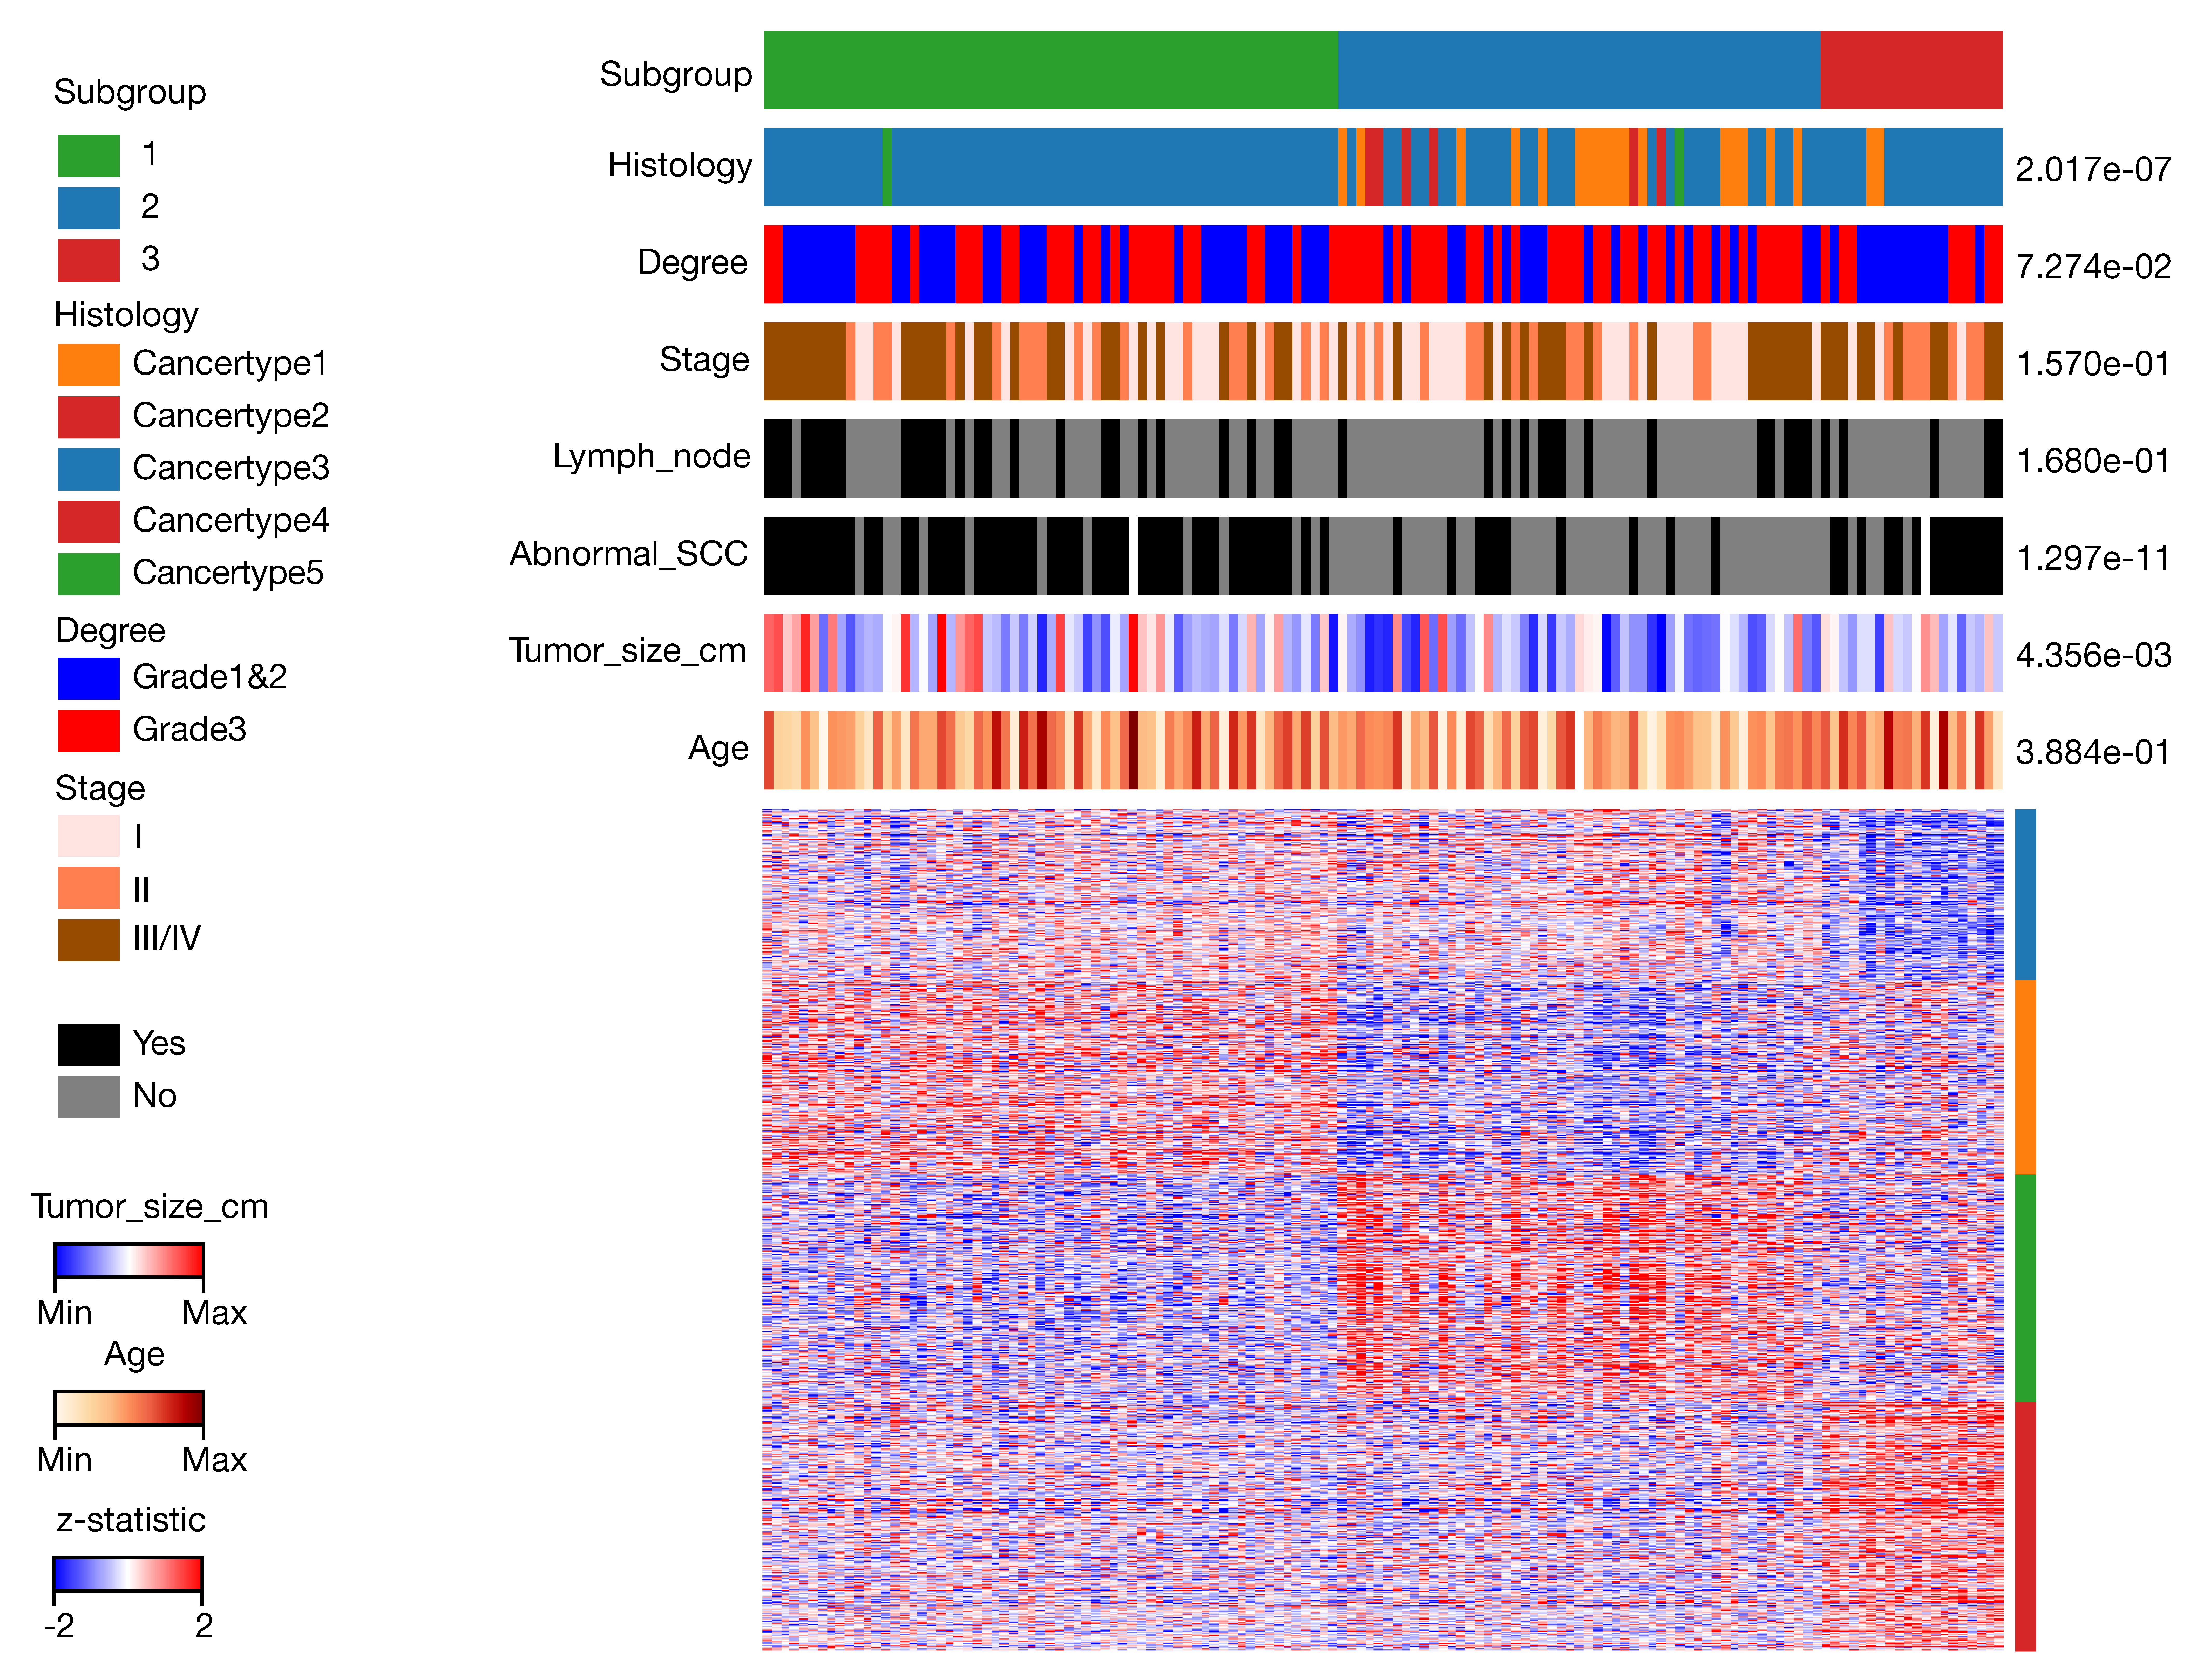
Association with clinical feature
samples underwent grouping using the z-statistic matrix derived from HVPs, with the intent of correlating proteomic subgroups to clinical and molecular features. We then employed either the Chi-square test or Fisher's exact test to examine the association between proteomic subgroups and discrete sample features. This choice was made based on the number of categories within each feature. For continuous features, we utilized Student’s t-test or ANOVA.
ANOVA was further applied to pinpoint differentially expressed proteins (DEPs) among sample groups. Hierarchical clustering of proteins ensued, driven by the z-statistic matrix, revealing distinctive expression signatures. Following this, pathway enrichment analysis was conducted for each set of proteins.
