Association with mutation data
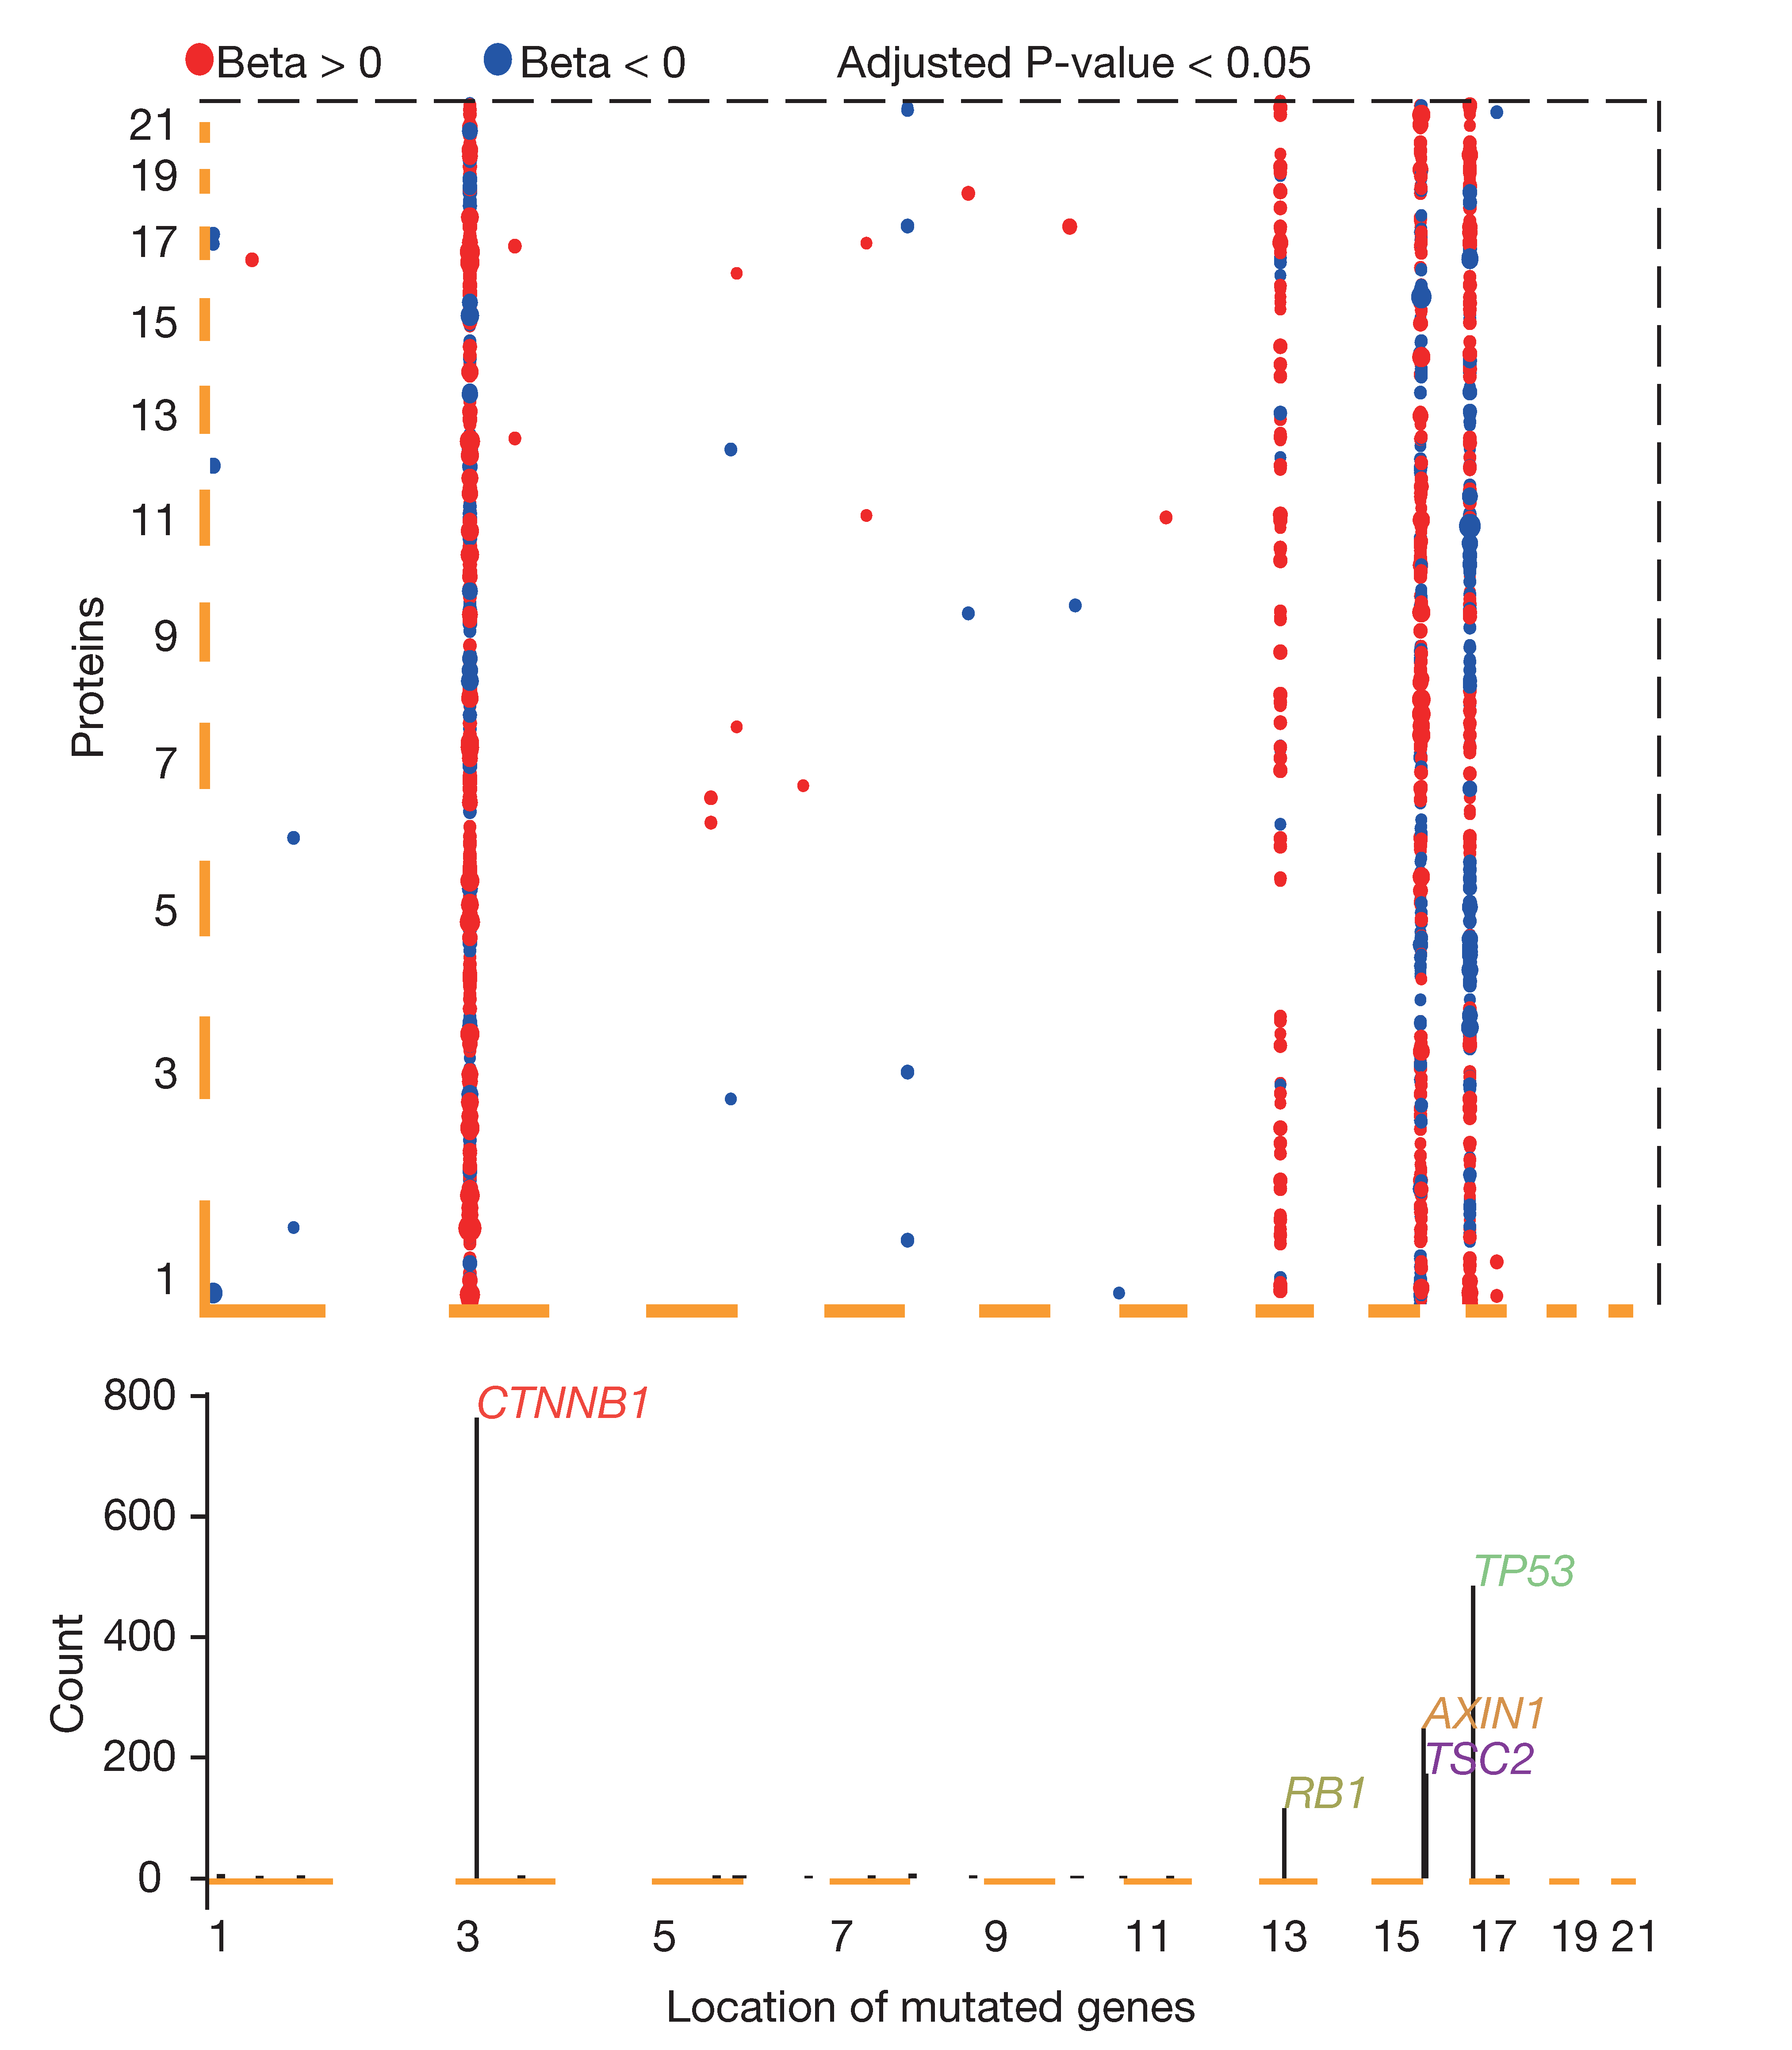
To pick out the proteins that were associated with non-silent somatic mutations, QTL analysis is used. Somatic mutations in at least 10 samples (Users determine based on the number of samples). Then, we pick out the proteins whose expression was detected in at least half of the tumor samples. Finally, for each candidate gene-protein pair, we performed a regression of the protein expression against the mutation status of the gene using MatrixEQTL R package, by fitting the following linear model: Y = α + βX + γS + δA+ε. Here, Y was a vector of the z-statistics of the protein in tumor samples; X was the non-silent somatic mutation indicators of the gene; S and A referred to the sex and age variables, respectively, as well as other control variables; ε was a vector of independent and identically distributed noise variables; α, β, γ, and δ were unknown parameters. This model was fitted by applying the least squares method, and the null hypothesis β=0 was then tested by applying the t-test.