Contents
- 1. What is CARMO?
- 2. Function Annotation
- 2.1 Data Input
- 2.2 Expression Enrichment
- 2.3 Functional Enrichment
- 2.4 Gene Module Enrichment
- 2.5 Co-expression Co-function Network
- 2.6 Tissue Expression Profile
- 3. Transcriptomic Annotation
- 4. Genomic Sites Annotation
- 5. Track Your Tasks
1. What is CARMO?
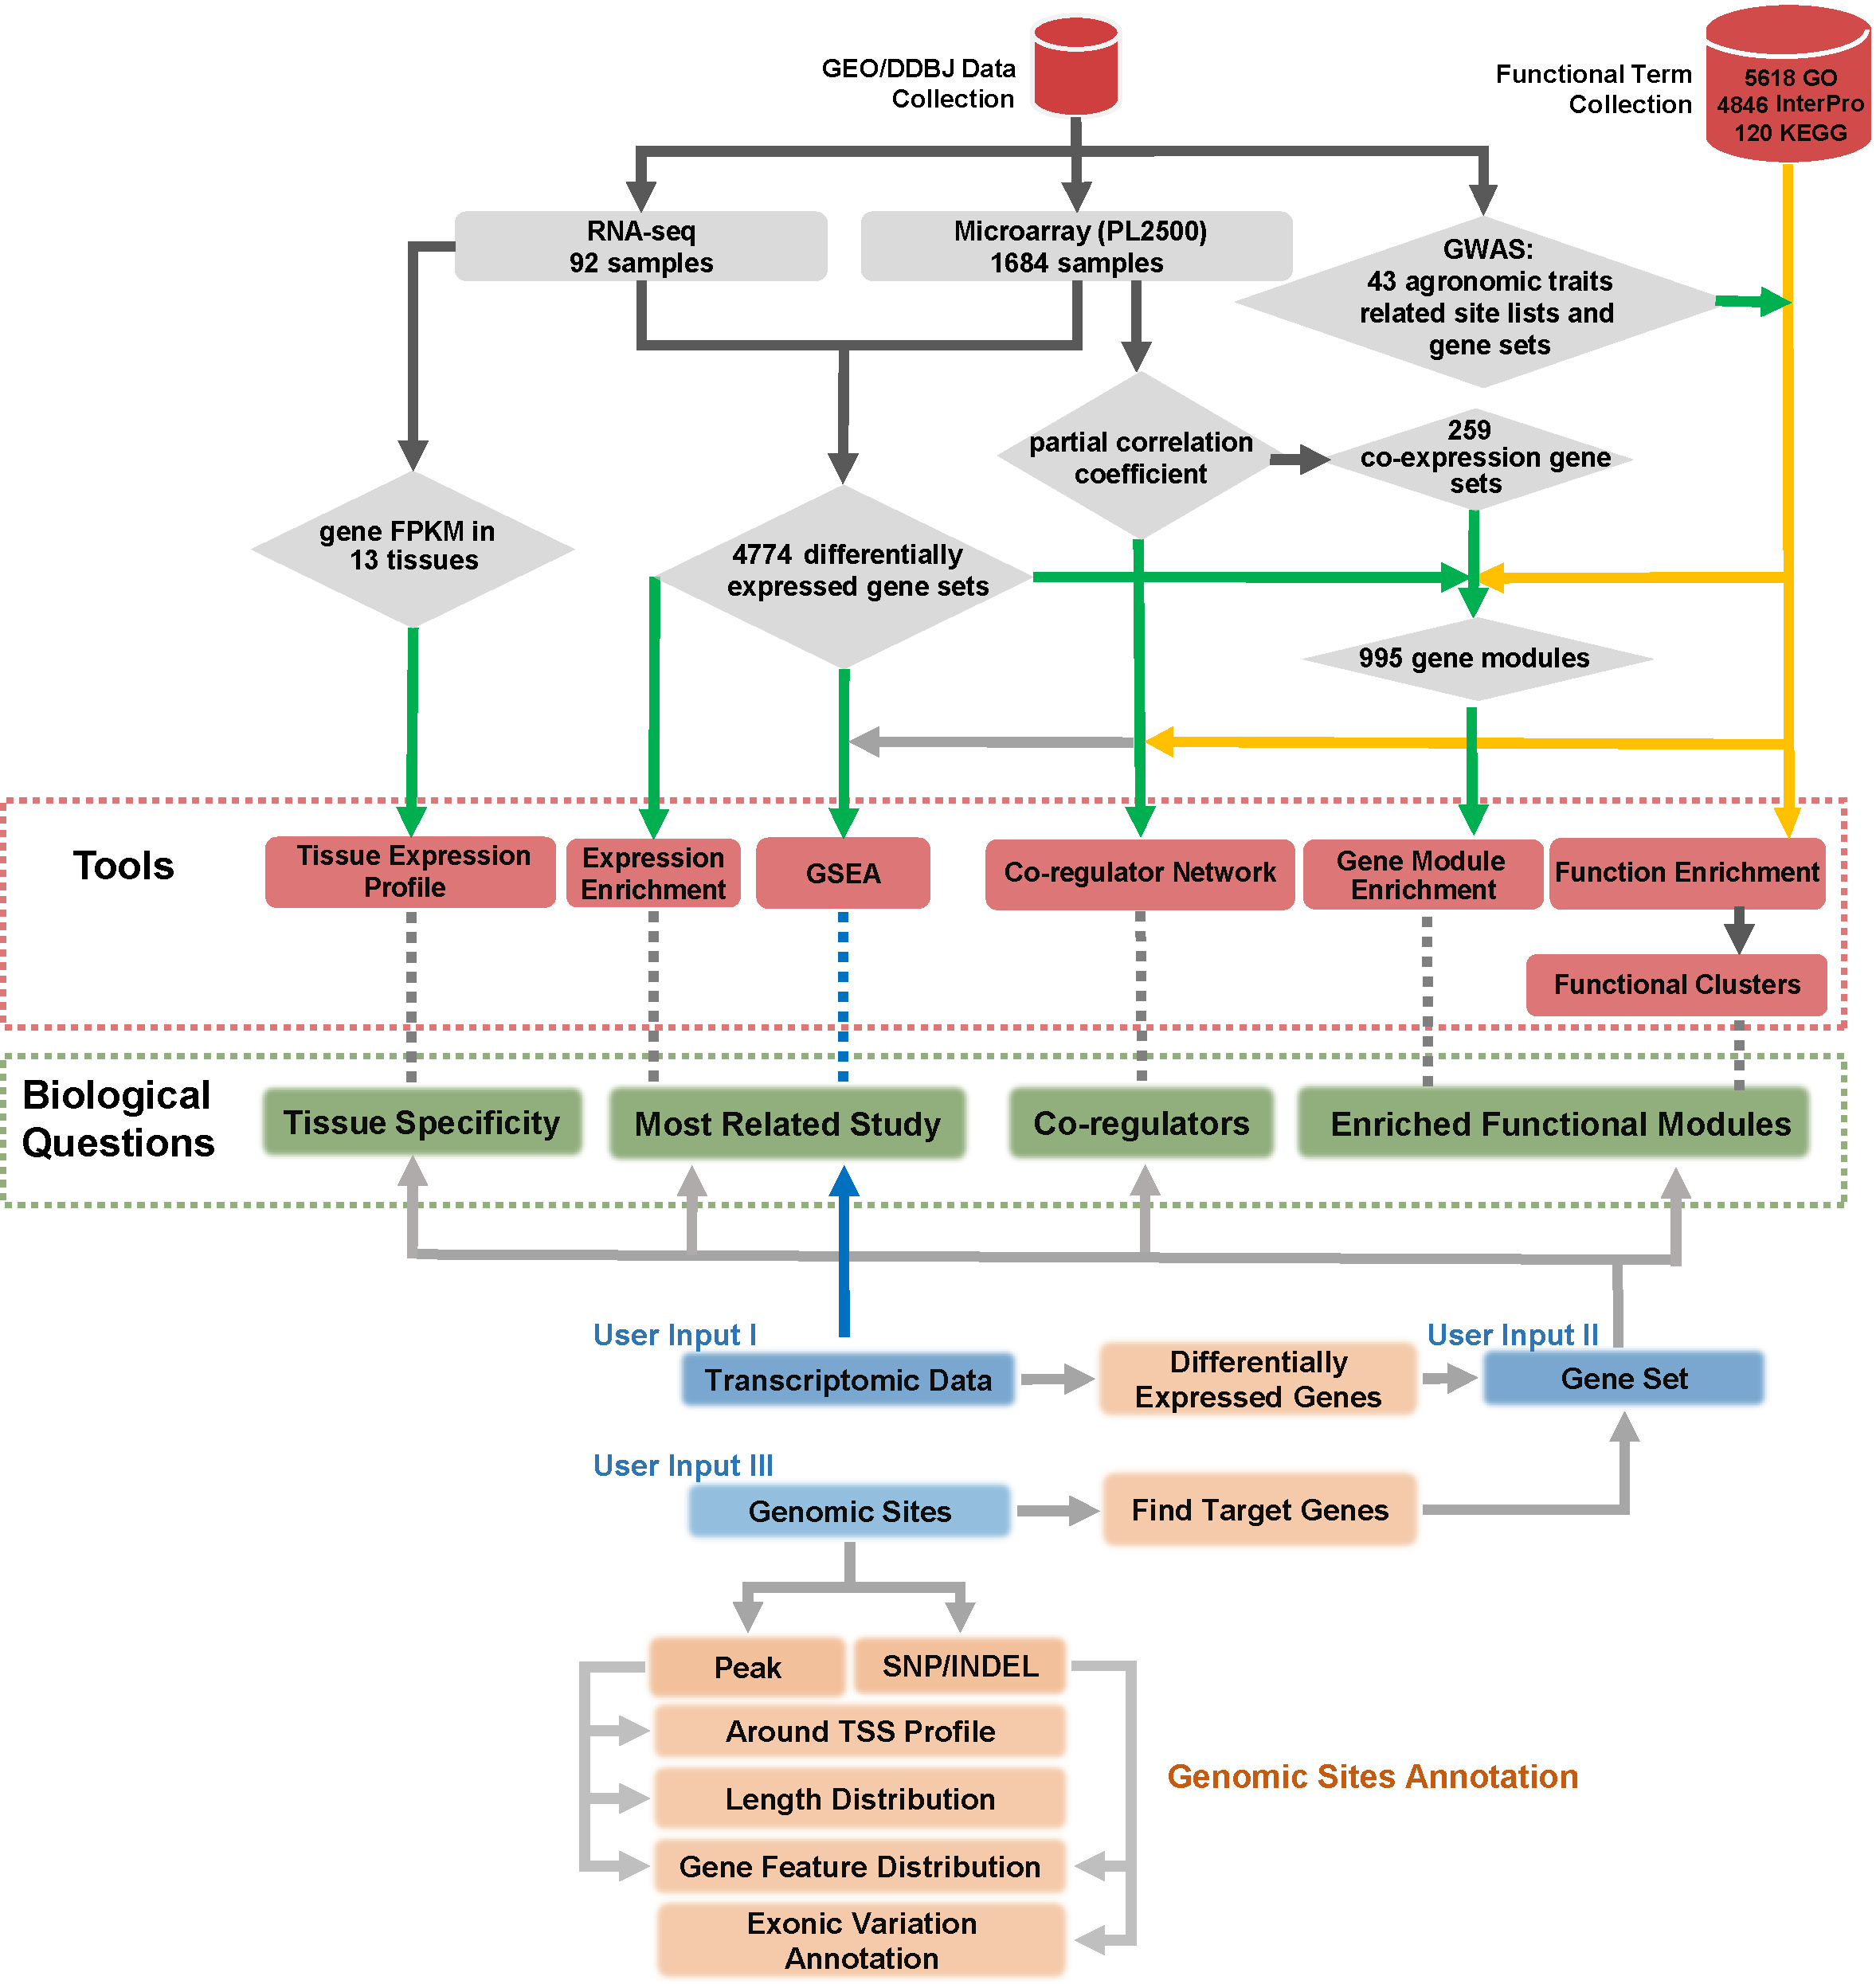
CARMO, Comprehensive Annotation of Rice Multi-Omics is a web-based platform providing comprehensive annotations for multi-omics data, including transcriptomic data sets, epi-genomic modification sites, SNPs from genome re-sequencing, and the large gene lists derived from these omics studies. Well-organized results, as well as multiple tools for interactive visualization, are available through a user-friendly web interface.
The power of CARMO lies in the comprehensive collection and integration of information from both multi-omics data and diverse functional evidence of rice, which was further curated into gene sets and higher level gene modules. In this way, the high-throughput data can easily be compared across studies and platforms, and notably, integration of multiple types of evidence provides biological interpretation from the level of modules with high confidence.
2. Function Annotation
2.1 Data Input
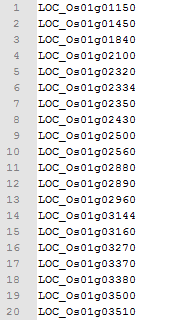
To submit the gene set, you can paste your gene list in the text area or upload a gene list file. Three types of rice gene ids are accepted, including MSU RGAP ID (e.g. LOC_Os07g46950), RAP-DB ID (e.g. Os04g0125700), Affymetrix Probe ID (e.g. Os.10002.1.S1_at).
For input MSU RGAP ID or RAP-DB ID, the type of output locus id is the same with input locus id; for Affymetrix Probe ID, the output gene model is from MSU RGAP. For any input gene model, users could look up the corresponding gene ids from both MSU RGAP and RAP-DB from the resulting gene annotation page.

NOTE: Gene list should be one id per line.
Five web-based tools are available to provide in-depth data mining services for given gene lists, including Expression Enrichment, Functional Enrichment, Gene Module Enrichment, Co-regulator Network and Tissue Expression Profile. More detailed information regarding each tool will be discussed in the following sections.

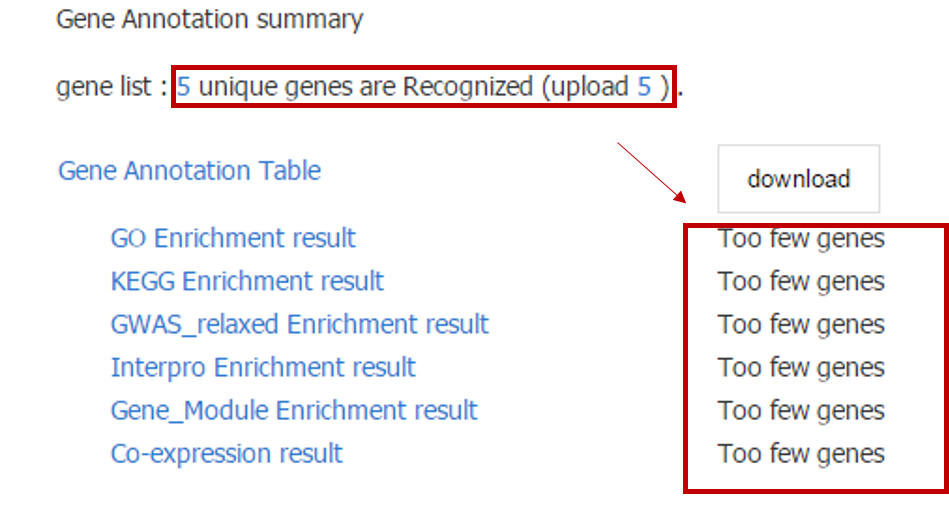
To perform the above analyses, the number of input genes must be greater than 10; otherwise, only descriptive information of the input genes will be shown.
In addition, for Tissue Expression Profile, a heatmap of only top 50 genes will be shown for the consideration of performance, and all expression information could be downloaded.
2.2 Expression Enrichment
2.2.1 Introduction
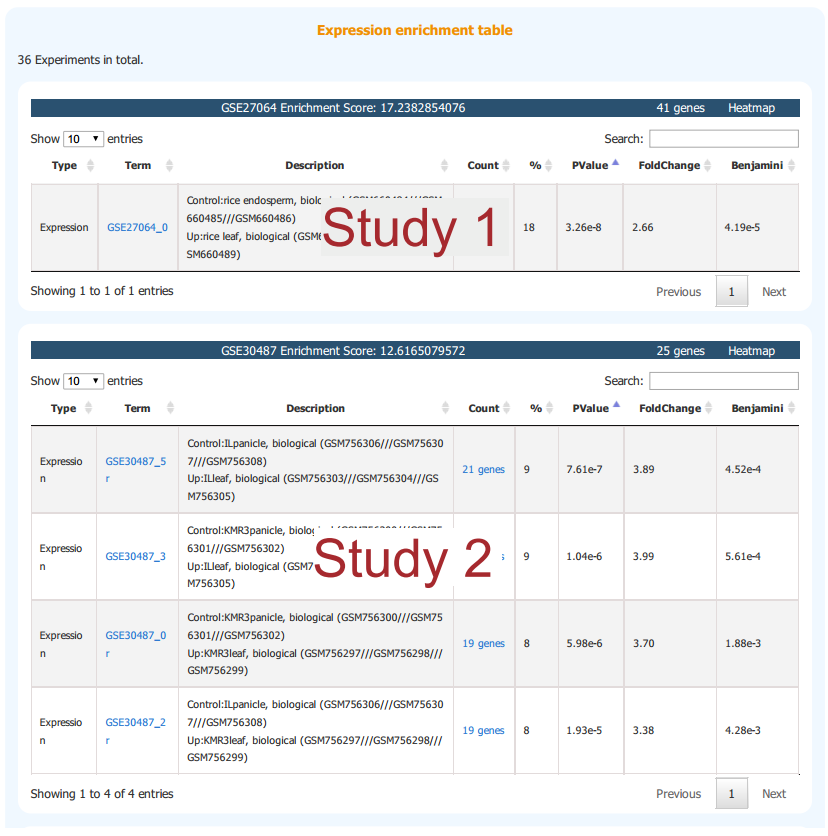
The purpose of Expression Enrichment is to find the most related transcriptomic study to the input gene set. CARMO has compiled up- and down-regulated gene sets based on pair-wise comparisons from available transcriptomic studies. If the input gene list is highly enriched in the pre-defined up- or down-regulated gene sets, the information of corresponding comparisons and studies are returned, ranked by the enrichment significance. Notably, this analysis is time consuming and is not performed by default.
2.2.2 Result Interpretation
Enriched studies are listed and ranked by enrichment score. Each table represents a study where all enriched pair-wise sample comparsions are listed. Sample information can be found in the description column.
2.3 Functional Enrichment
2.2.1 Introduction
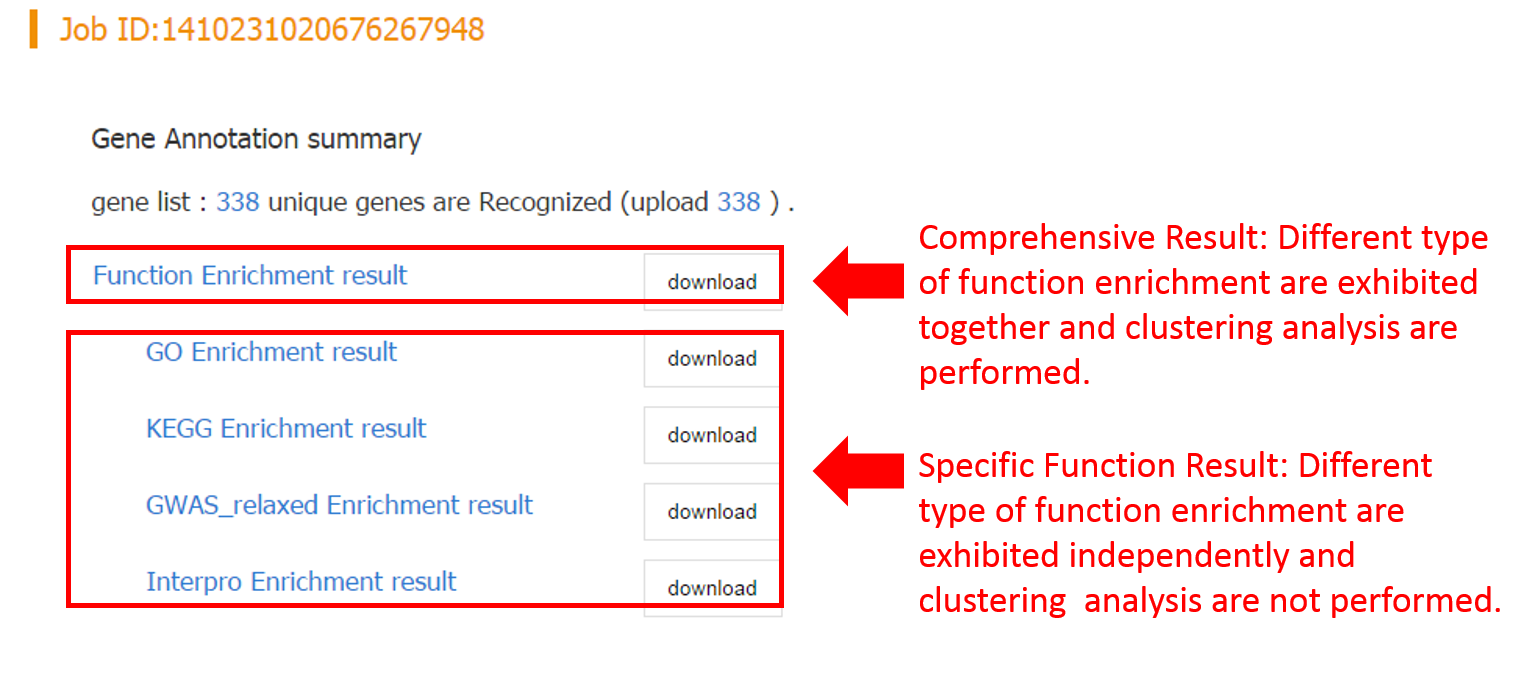
Four tools are embeded in this analysis, i.e. GO enrichment, KEGG enrichment, InterPro enrichment and GWAS phenotype enrichment, which can be performed both independently and jointly.
2.2.2 Result Interpretation
For each enrichment analysis, the result page contains the summary table about enriched functional terms and enrichment statistics. It worth noting that if more than one tool performed, a functional clustering network will be generated, which clusters redundant and relavent functional terms to the same cluster, and thus greatly facilliates functional interpretation of the input gene list.
a. Clustering Result
All enrichment terms are clustered into different groups via MCL algorithms, each table containing several clutered terms

Enrichment score: calculated as the geometric mean (in -log scale) of member's p-values.
86 uniq genes: all genes in the cluster, which provides a link to Gene Annotation Table of these genes.
Heatmap: heatmap table showing the matrix of enriched functional terms for the gene list. Each column represents one functional term and each row represents a gene. Blue boxes mean “hiting” while yellow boxes mean “no hit”.

Following is the description for each column of the table:
| Columns | Interpretation |
|---|---|
| Term | The name of unctional term |
| Description | The description of functional term |
| Count | The number of input genes hit the functional term |
| % | Count/No. of input genes |
| PValue | Enrichment pvalue calculated by modified Fisher Exact Test |
| FoldChange | Fold enrichment |
| Benjamini | Multiple testing correction using Benjamini-Hochberg procedure |
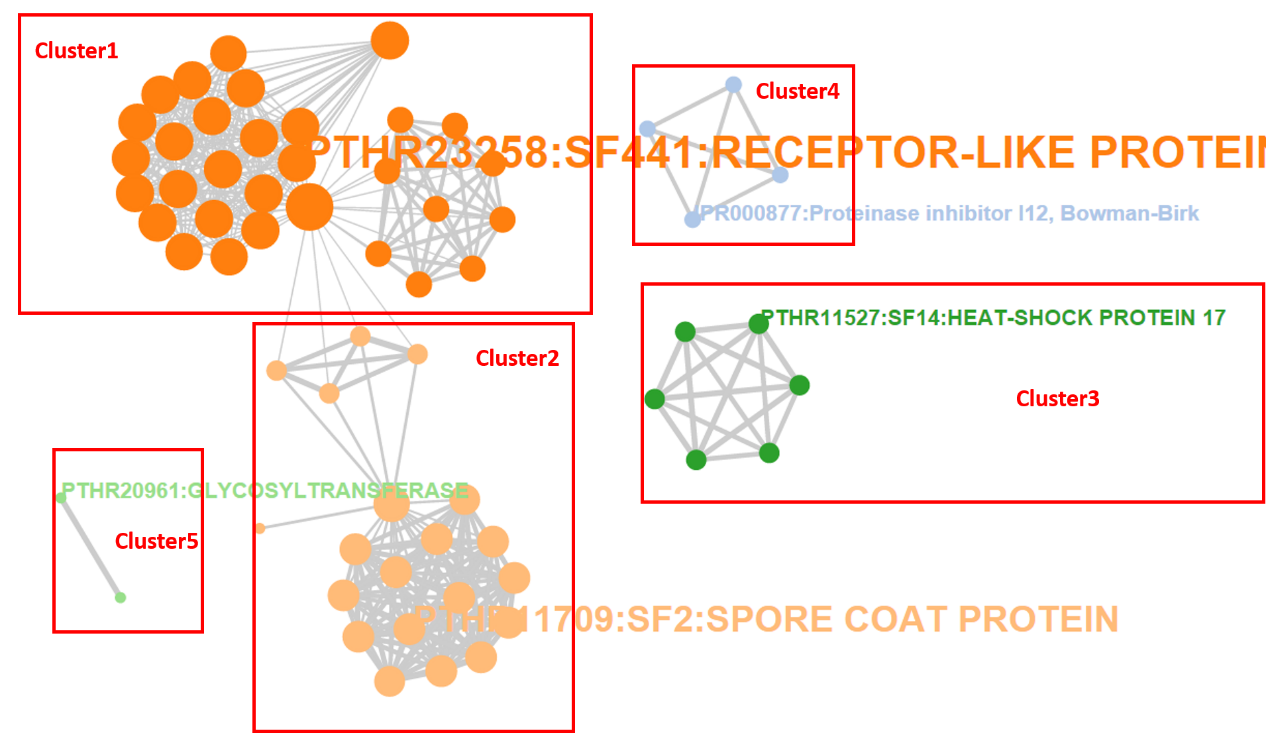
Importantly, a functional network is generated to dispaly the relationship among enriched functional terms. Different clusters are represented in distinct colors. The length of an edge represents the number of genes shared by the two terms linked.
In addition, three options are provided to interactively adjust the layout of the network and the number of enriched terms: MCL Classification, Within Group Similarity and Enrichment Thresholds.
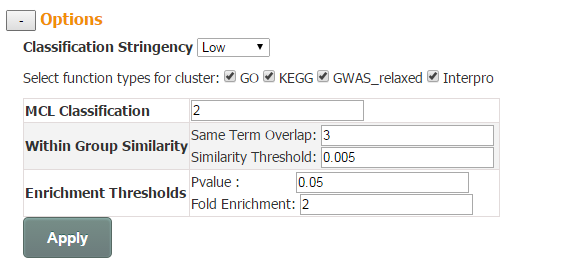
MCL Classification (control the number of clusters): a float number ranging from 1.2 to 5. In general, the larger the value is, the more clusters is generated.
Within Group Similarity (control the number of edges): this option provides two cutoffs for users to define whether 2 enriched terms are related and thus linked by an edge. First is the cutoff for absolute number of genes shared by related pair of functional terms. And the second is Similarity Threshold, which is the absolute number of genes shared normalized by the size of two related functional terms.
Enrichment Thresholds (control the number of nodes): p-value and fold enrichment cutoff of enrichment analysis.
b. Individual Functional Term Enrichment Result
Take GO enrichment result as an example, the result page is much simpler than the Functional Annotation Clustering result page. All enriched GO terms are listed in one single table. Heatmap is also available to show the relationship between input gene list and enriched terms.

In addition, the enriched terms and corresponding p-values could be visualized in a bar graph.
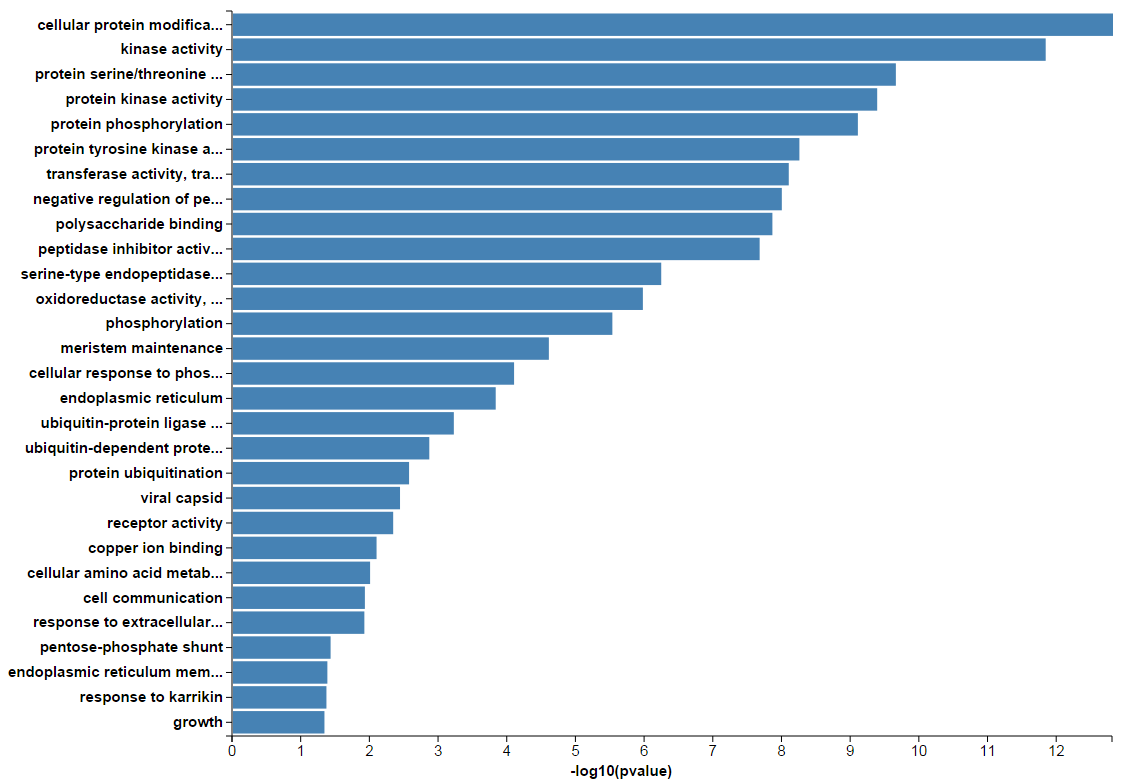
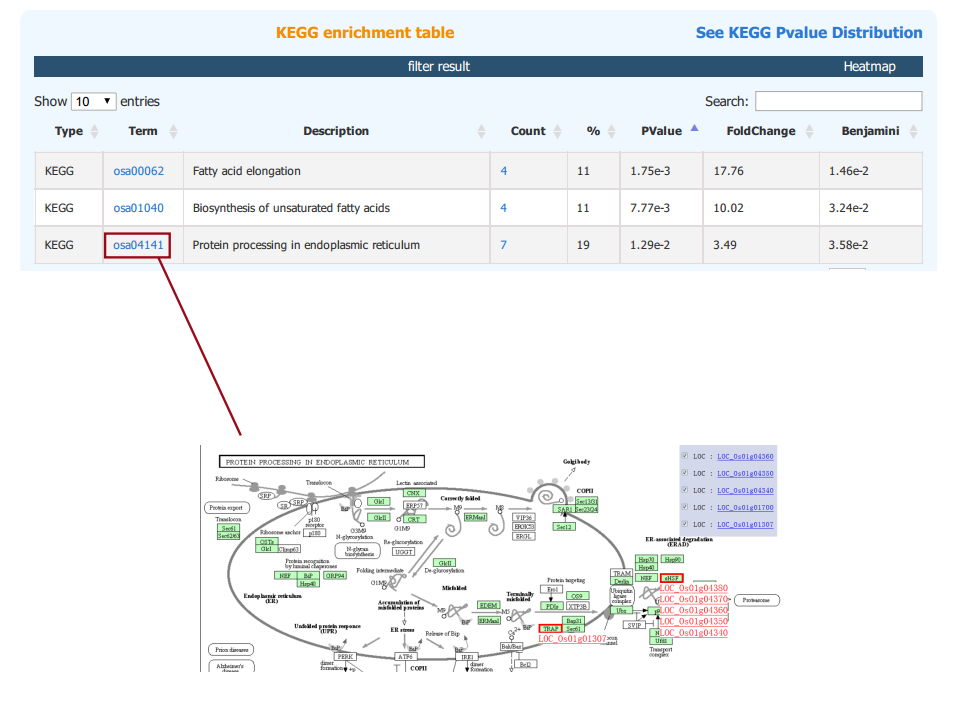
The results of KEGG, GWAS and InterPro enrichment are given in a similary way. Specifically, the result page of KEGG enrichment provides a link to the pathway graph where the input genes are highlighted.
2.4 Gene Module Enrichment
2.4.1 Introduction
We organized gene sets of related function showing coordinated expression into higher-level modules, such that one gene module represents a group of genes expressed in concert to carry out a specific function. In this way, the role of a gene with invalidated function can be deduced from its neighbors in the same module with relatively high confidence, since both sequence homology and experimental evidence are taken into account. We followed the widely-used method in cancer research proposed by Segal (Segal et al. 2004), and identified 995 statistically significant gene modules, representing 995 gene groups with concerted expression and related function.
2.4.2 Result Interpretation
In addition to the sumamry table describing the enriched gene modules, related input genes, and enrichment statistics, each module also provides a link to a heatmap showing the relationship between input genes and functional terms in the module. Each row represents a functional term involved in this gene module, and each column represents a gene. Both red and grey boxes indicate input genes with given functional annotation. For each term (row), red boxes indicate the expression behavior of these genes are similar and thus the enrichment is more reliable than genes marked by grey boxes. Yellow boxes represents "no hit".

2.5 Co-expression Co-function Network
Genes with concerted expression generally work in coordination (Stuart et al. 2003). To search for potential co-regulators of given genes, a co-expression network was constructed. Partial correlation coefficient was used to measure the tendency of co-expression, which is expected to recover direct relationship between genes (Kolpakov et al. 1998). Notably, each pair of co-expressed genes are connected by an edge, which is highlighted in blue if they also share common functions, indicating relatively strong evidence for co-regulation between the pair of genes linked.
2.5.1 Options
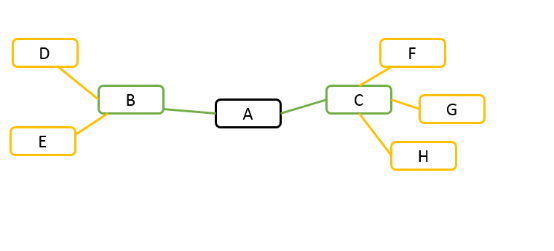
For example, given gene A in the following diagram. If search depth is 1, all genes have correlation coefficients above the cutoff with gene A are presented, for example, gene B and gene C. If search depth is 2, in addition to gene B and gene C, genes co-expressed with gene B and gene C are also presented.
2.5.2 Result Interpretation:
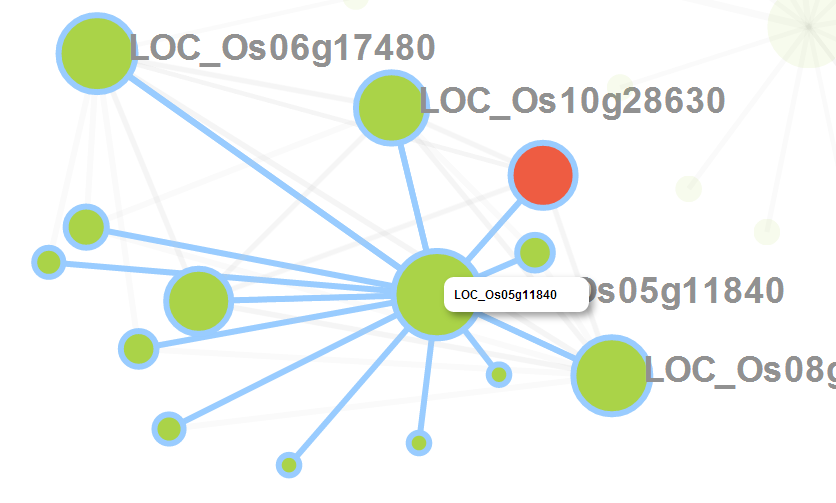
An interactive co-expression network will be generated by CARMO. Each pair of co-expressed genes are connected by an edge, which is highlighted in blue if they also share common functions, indicating relatively strong evidence for co-regulation between the pair of genes linked. Co-expression network panel:
- Button "Highlight": Highlight the input genes in the network
- Button "More": Show more gene names
- Button "Less": Show less gene names
- Button "Save": Export the network graph in svg format
- Button "Reset": Reset the graph to the initial status
- Button "Cofunction": Highlight the co-function relationship
- Button "Download": Download the correlation coefficient table.
When you click the node in the network, it would be highlighted in the network. Meanwhile, the corresponding row in the gene table is also highlighted and vice versa. In addition, you can zoom in/out and drag the graph by your mouse.


When users hover the pointer over one node, its neighbor nodes will be highlighted.
2.6 Tissue Expression Profile
2.6.1 Introduction
We collected 27 RNA-seq samples from 13 rice tissues. After pre-processing, we obtained the gene expression level of FPKM across these samples. And statistical tests are performed to detect genes with tissue biased expression..
2.6.2 Result Interpretation
Matrix of the log2(FPKM) for each input gene (row) across 27 sampes (columns) are presented. Tissue specific expression are highlighted by blue box.
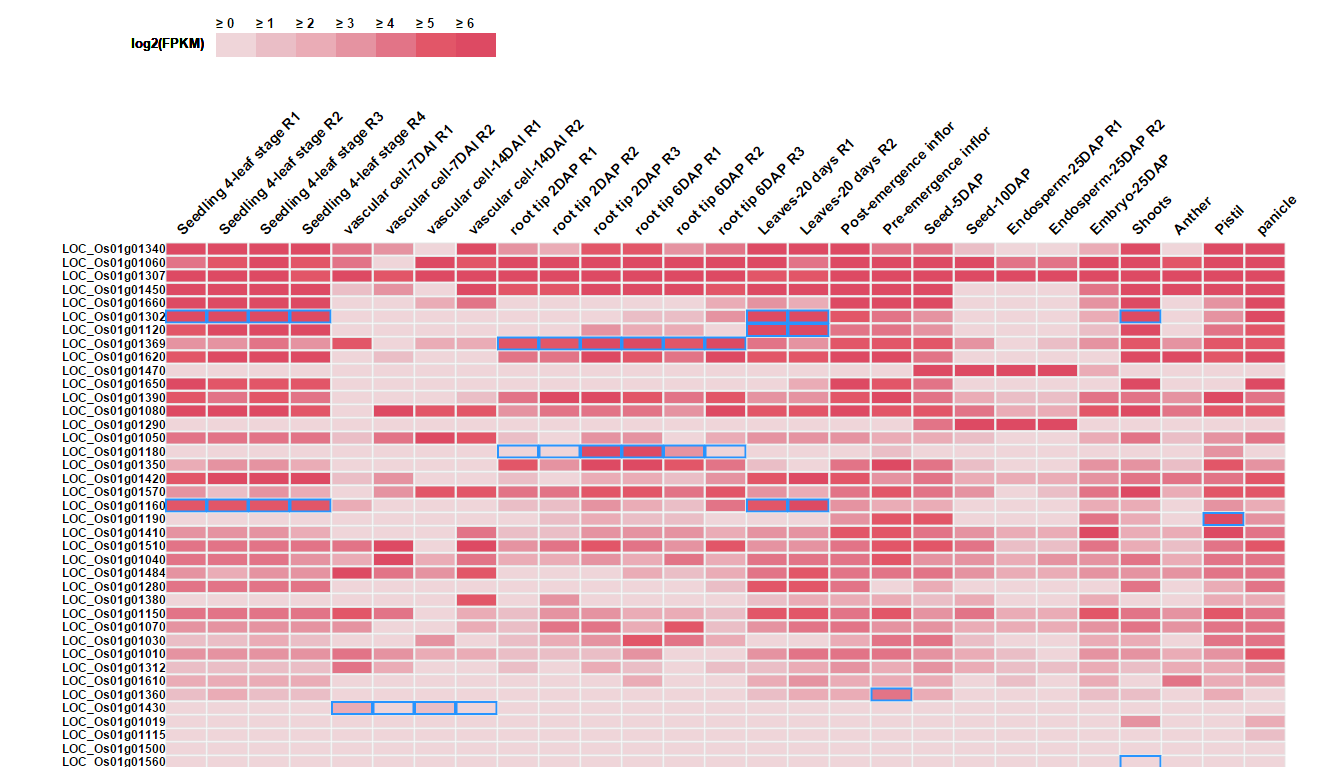
Note: Only top 50 genes are shown in the heatmap. The matrix of expression information for all genes could be downloaded.
When hovering the pointer over the gene id, a bar graph of this gene's log2FPKM shows up. It is a more intuitive way to browse the expression variation across samples.

Users can download the heatmap and FPKM matrix through the button on the top. All FPKM values are log2 transformed.
3. Transcriptomic Annotation
3.1 Pair-wise Comparison
3.1.1 Data Input and Options
Expression file in gct format and phenotype file in cls format.
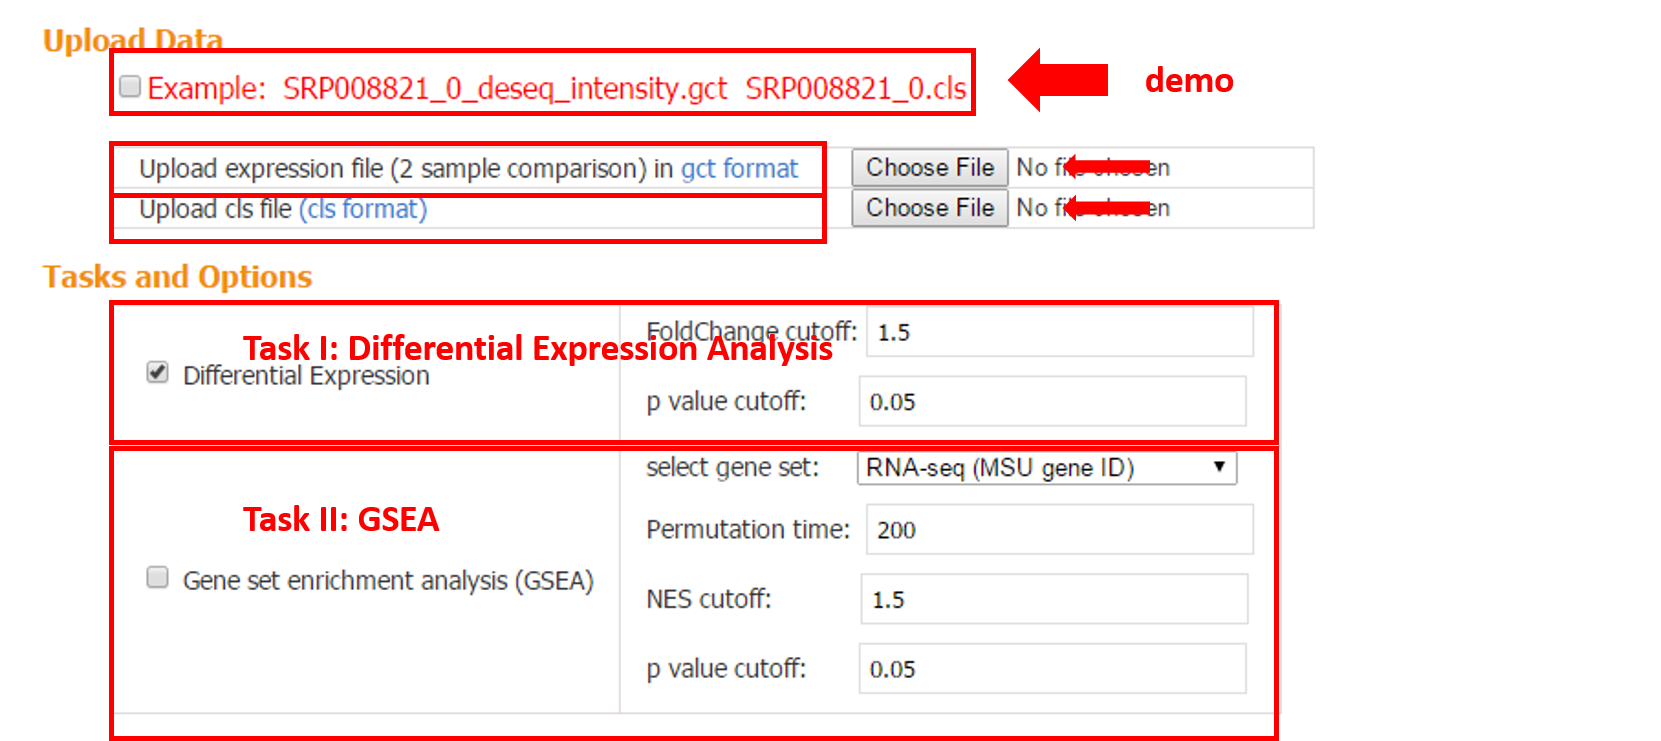
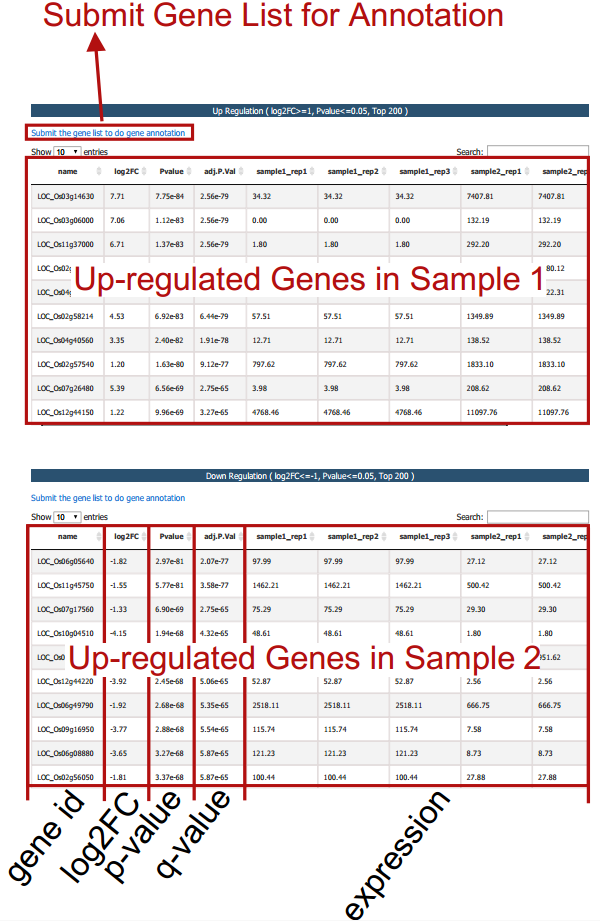
3.1.2 Task I: Differential Expression
Differential expression analysis is performed based on the input gct and cls file. Two gene tables (up- and down-regulated) are provided.
3.1.3 Task II: Gene Set Enrichment Analysis (GSEA)
GSEA-R developed by Broad Institute is implemented, which requires two user inputs: gene set and expression data. The purpose of GSEA is to test whether given gene sets are enriched in the up- or down-regulated genes from pair-wise comparison. In addition, the rank can be taken into account with proper choice of the scoring metric.
The current version of CARMO contains four types of pre-compiled gene sets for GSEA, including differentially expressed gene sets from pair-wise comparison of transcriptome datasets, functional terms, domain information and pathways. Related statistics including p-value, q-value, fold change and enrichment score are listed in the result table.
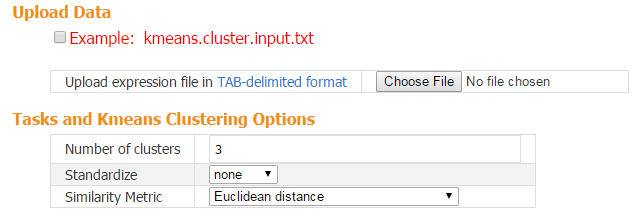
For more details about GSEA, please refer to http://www.broadinstitute.org/gsea/index.jsp.3.2 Multiple Comparison
When the input contains multiple transcriptome samples, CARMO applies k-means clustering to group genes into different groups with distinct expression profiles across samples. Genes in each cluster can further be submitted for gene list annotation.

4. Genomic Sites Annotation
4.1 Peak Annotation
4.1.1 Data Input I: one peak file in bed format
Summit position of a peak is used to plot peak distribution. If summit is not provided, the middle of input peak is used as peak summit.
4.1.2 Peak Annotation Plot
a) Peak Around TSS Distribution.
You can use upstream option and downstream option to define the range of the profile. The bin option indicates the length of genomic region to record the number of peaks within the region. The smooth option is the bin number that is smoothed. Larger number resulted in smoother curve.
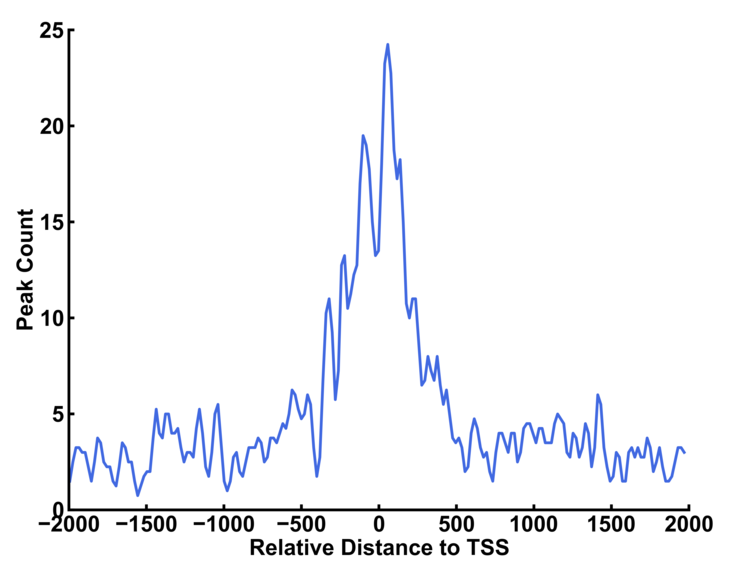

The left curve is plotted with default smooth value (=5 bins). The smooth value is set to 20 for the right curve.
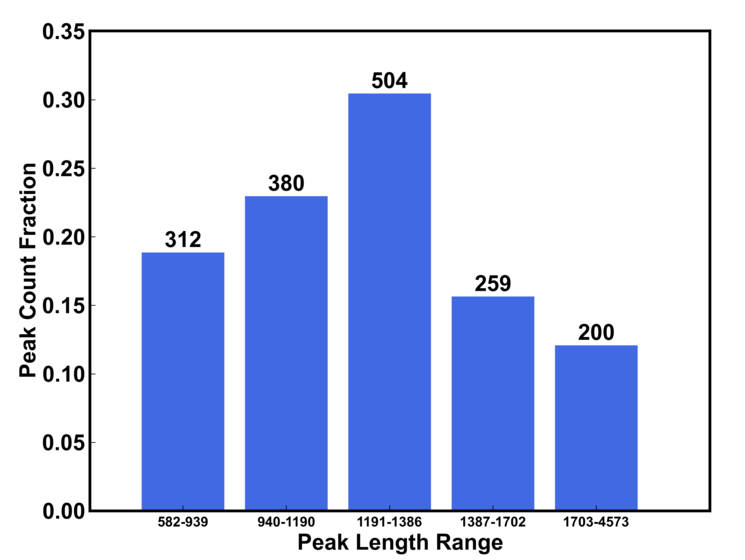
b) peak length distribution
The length range are dynamically determined by the peak file. The number on the top of bar is the number of peak whose length is within the range and the height of the bar (y axis) is the fraction of peaks.
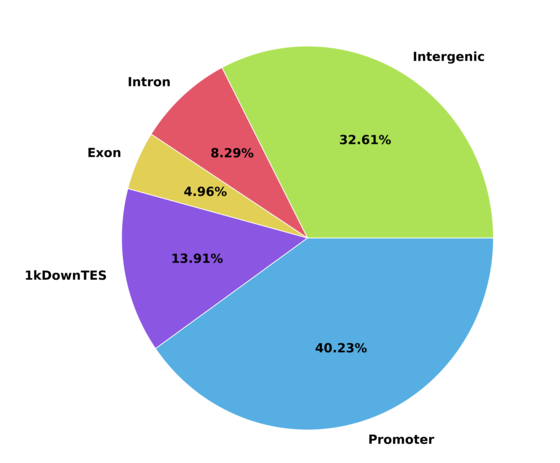
c) Peak feature distritbution graph
Peak distribution in relation to gene annotation. Promoter region can be defined using upstream and downstream options.
d) Target gene annotation
Target genes can be submitted for gene annotation analysis (see Gene Annotation part)
4.1.3 Data Input II: two peak files when your experiment involves two samples under comparison
CARMO will first divide the two inputs to common and unique peak files, summarize peak statistics, detect common and unique target genes, and perform integrative functional analyses for each gene list.
4.2 SNP Annotation
SNP Annotation module is the web implement of ANNOVAR, a widely used SNP annotation tool.
Data Input: a standard vcf file [check vcf format detail]
The genomic position, mutation type, affected region and description of each input SNP are reported.

5. Track your tasks

Some analyses may take several hours, if your email address is given, a notification email will be sent to your mailbox once the task completed. Users can also assign different job names to manage diffenert tasks.
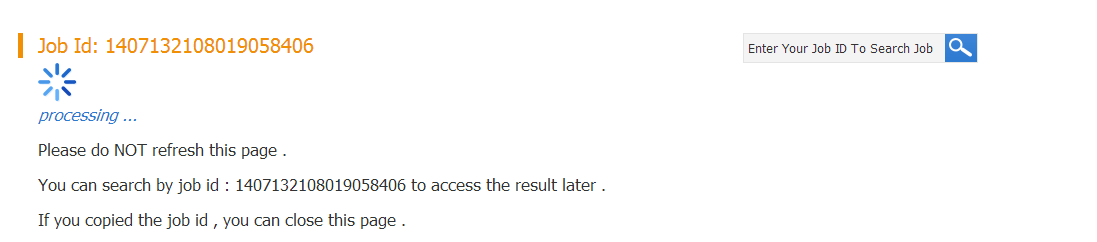
Another method to track your job is using job id, which will be generated as the task submitted. You can enter your job id in the search box to check the status of the job. If the job is completed, the result page will show up. Currently, the job result will be kept in our server for at least two weeks.
Reference
Kolpakov, F.A., Ananko, E.A., Kolesov, G.B. and Kolchanov, N.A. (1998) GeneNet: a gene network database and its automated visualization. Bioinformatics, 14, 529-537.
Segal, E., Friedman, N., Koller, D. and Regev, A. (2004) A module map showing conditional activity of expression modules in cancer. Nature genetics, 36, 1090-1098.
Stuart, J.M., Segal, E., Koller, D. and Kim, S.K. (2003) A gene-coexpression network for global discovery of conserved genetic modules. Science, 302, 249-255.