1 Search Functions
1.1 Locus ID Search
1.1.1 Data Input
1.1.2 Result
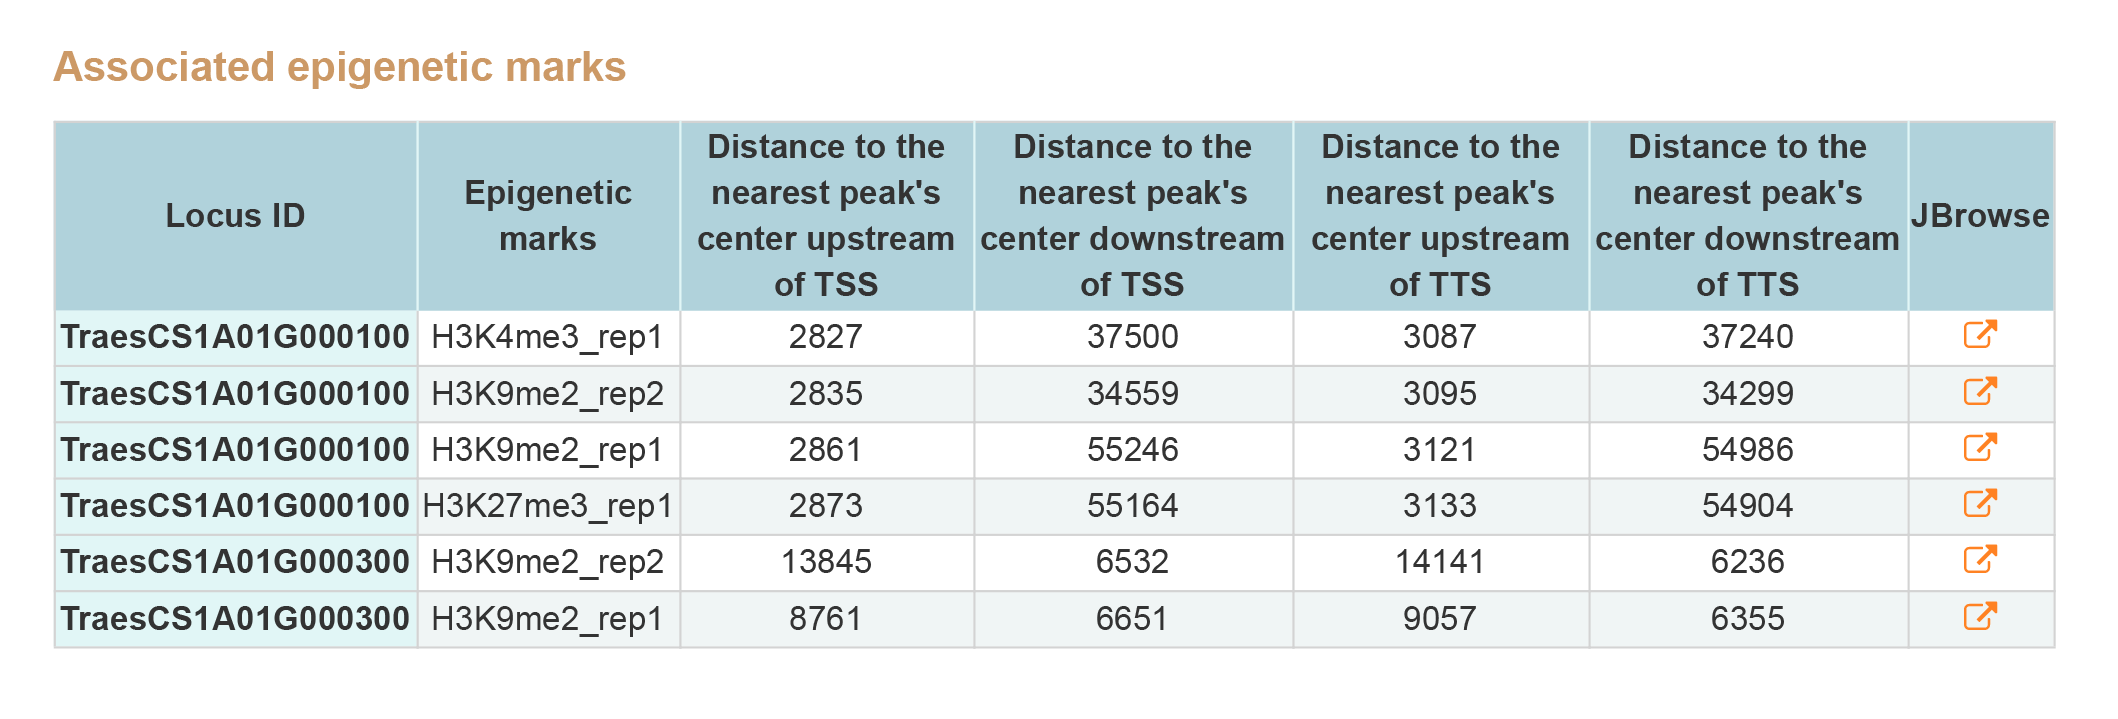
Locus ID Search contains two type of results, associated states and epigenetic marks around genes.By clicking JBrowse button view the information around gene.
1. Associated states.
2. Associated epigenetic marks.
1.2 TE Search
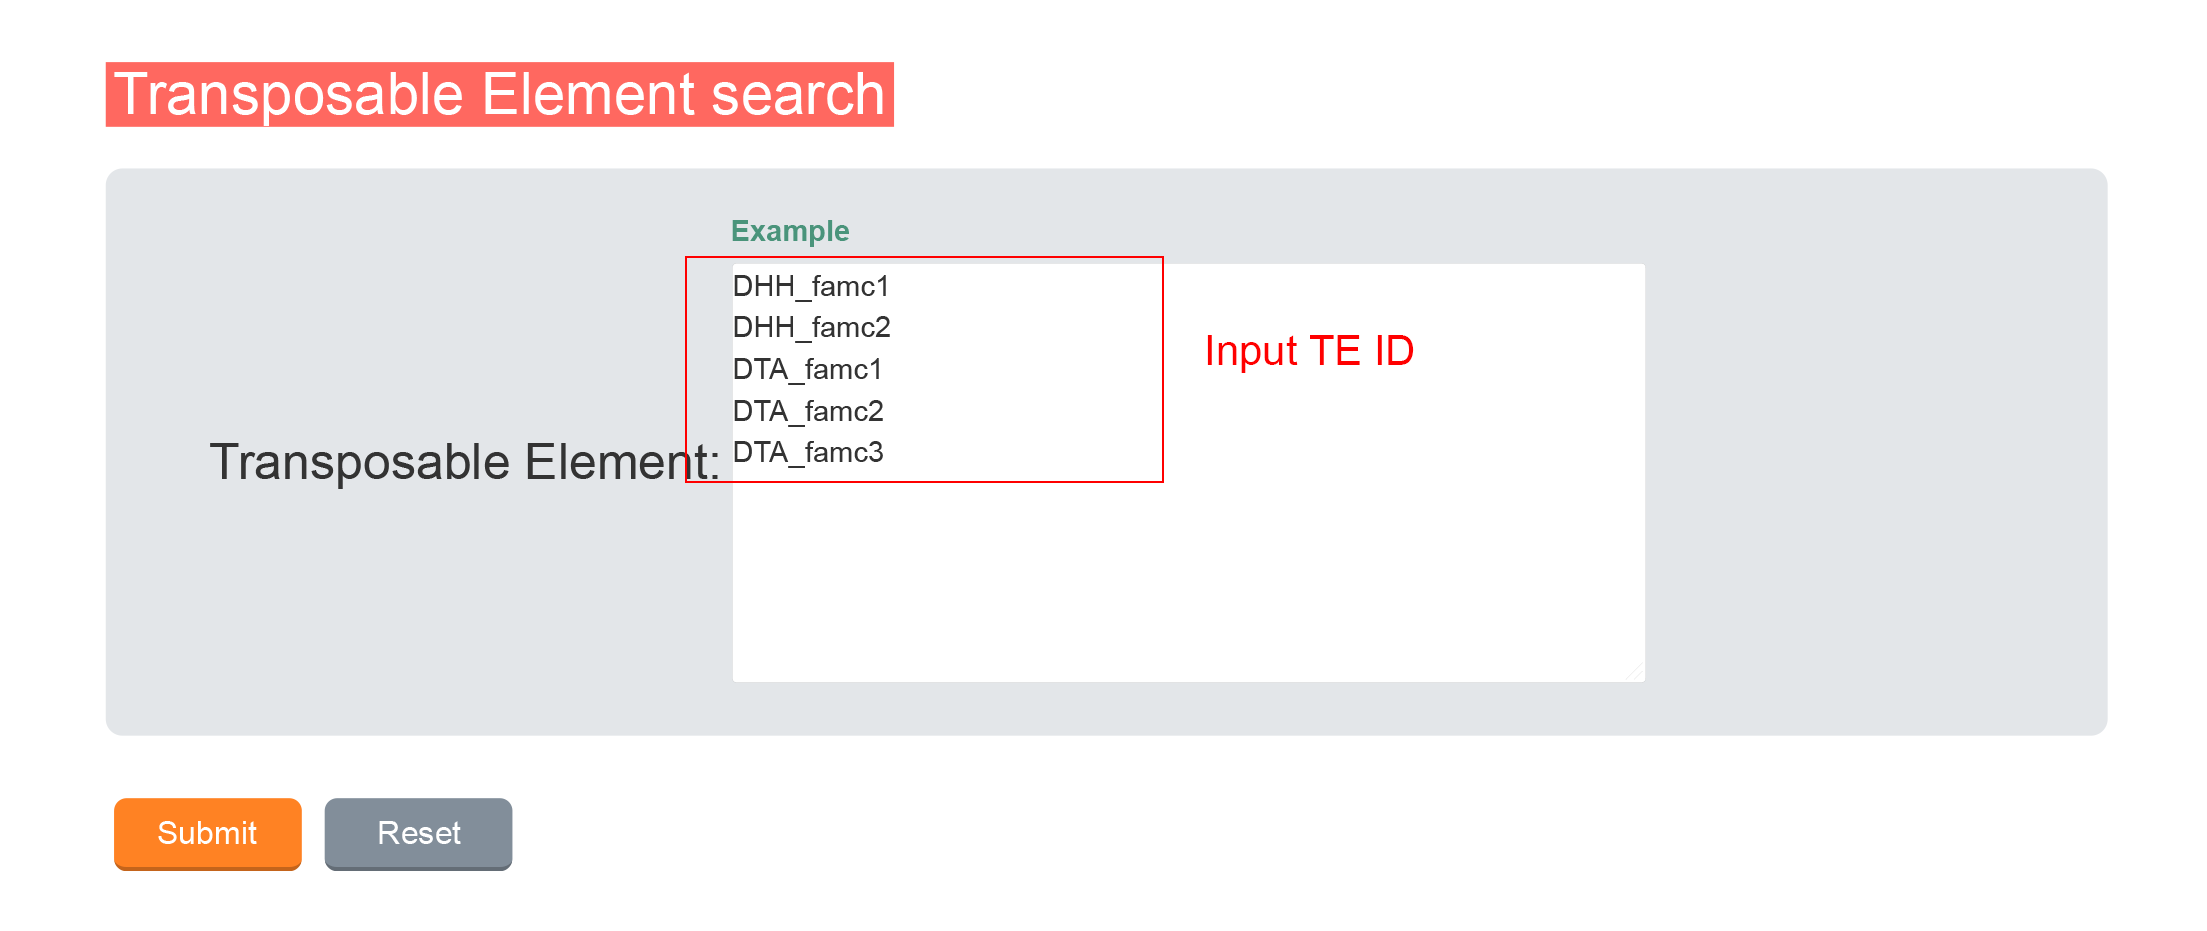
1.2.1 Data Input
1.2.2 Result
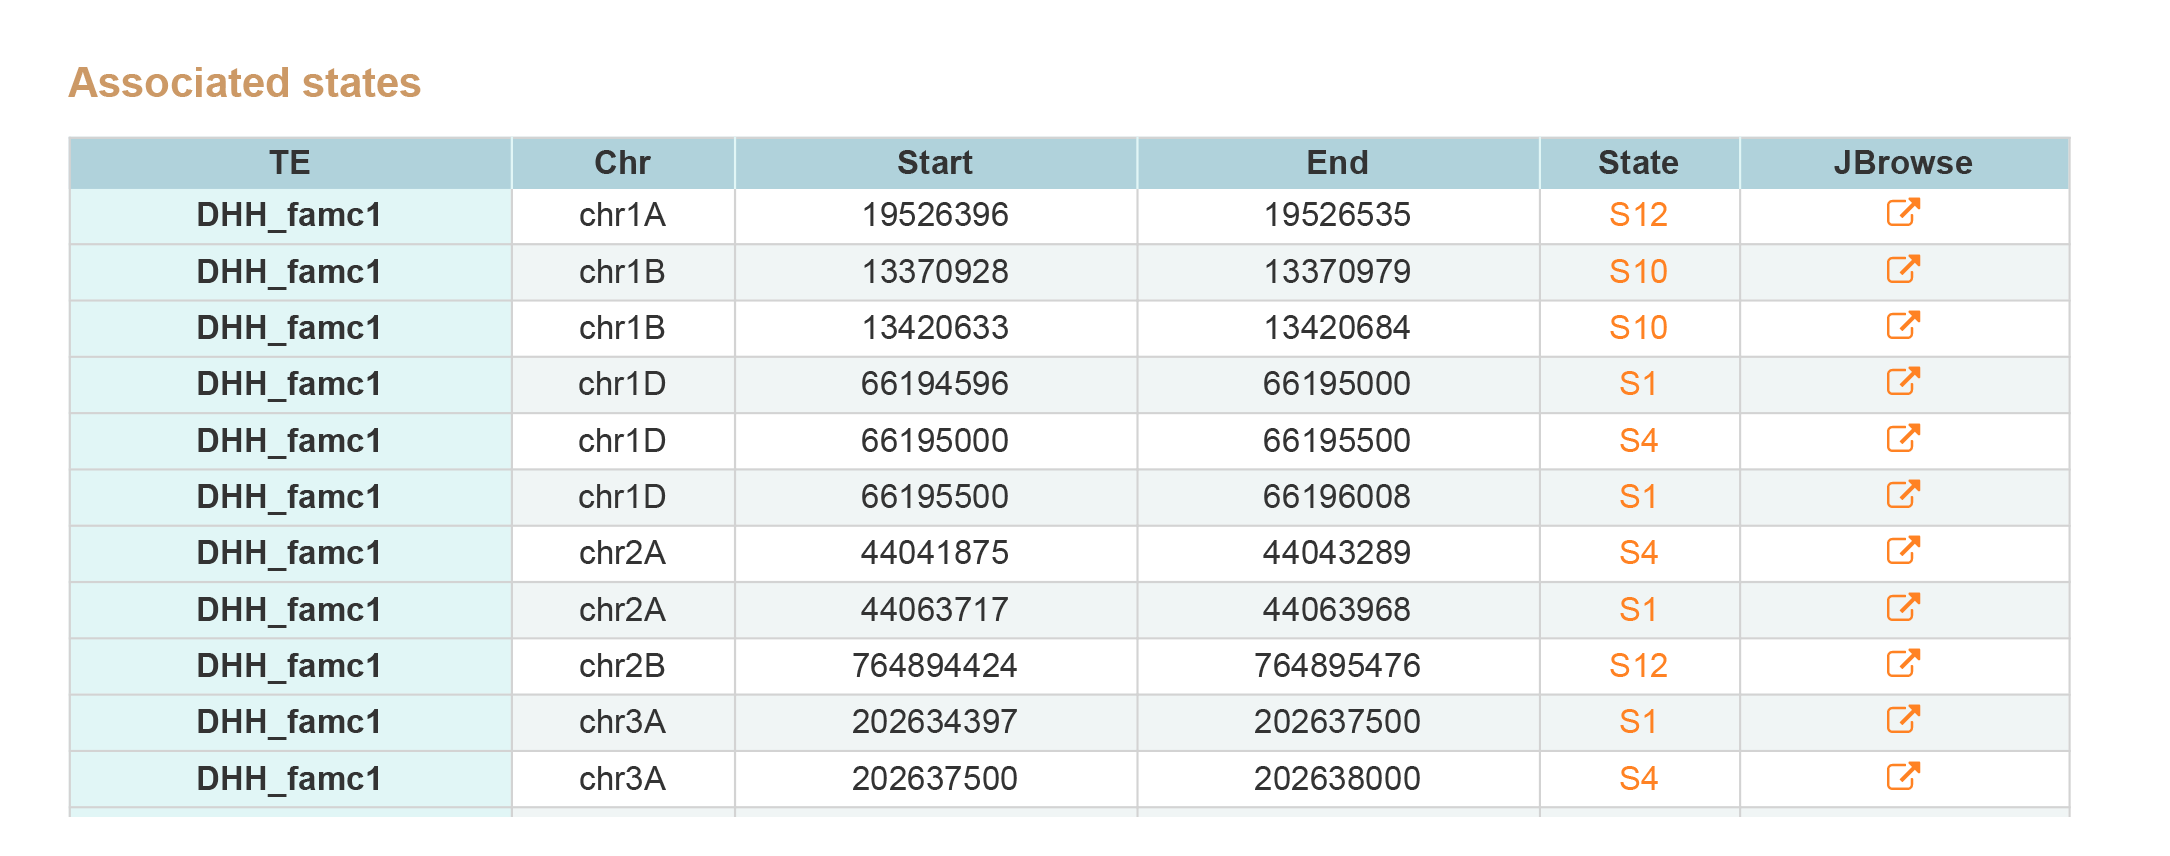
TE Search contains two type of results, associated states and epigenetic marks around TE.By clicking JBrowse button view the information around TE.
1. Associated states.
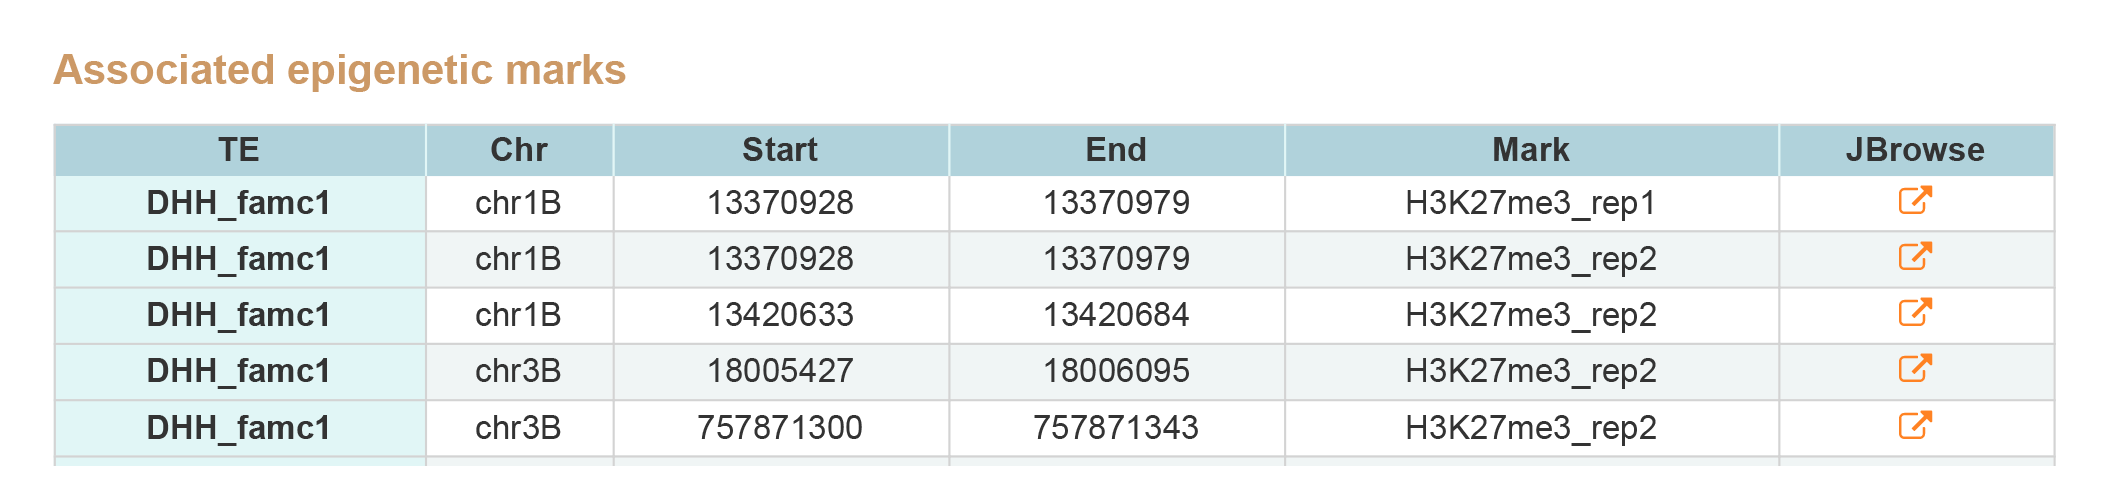
2. Associated epigenetic marks.
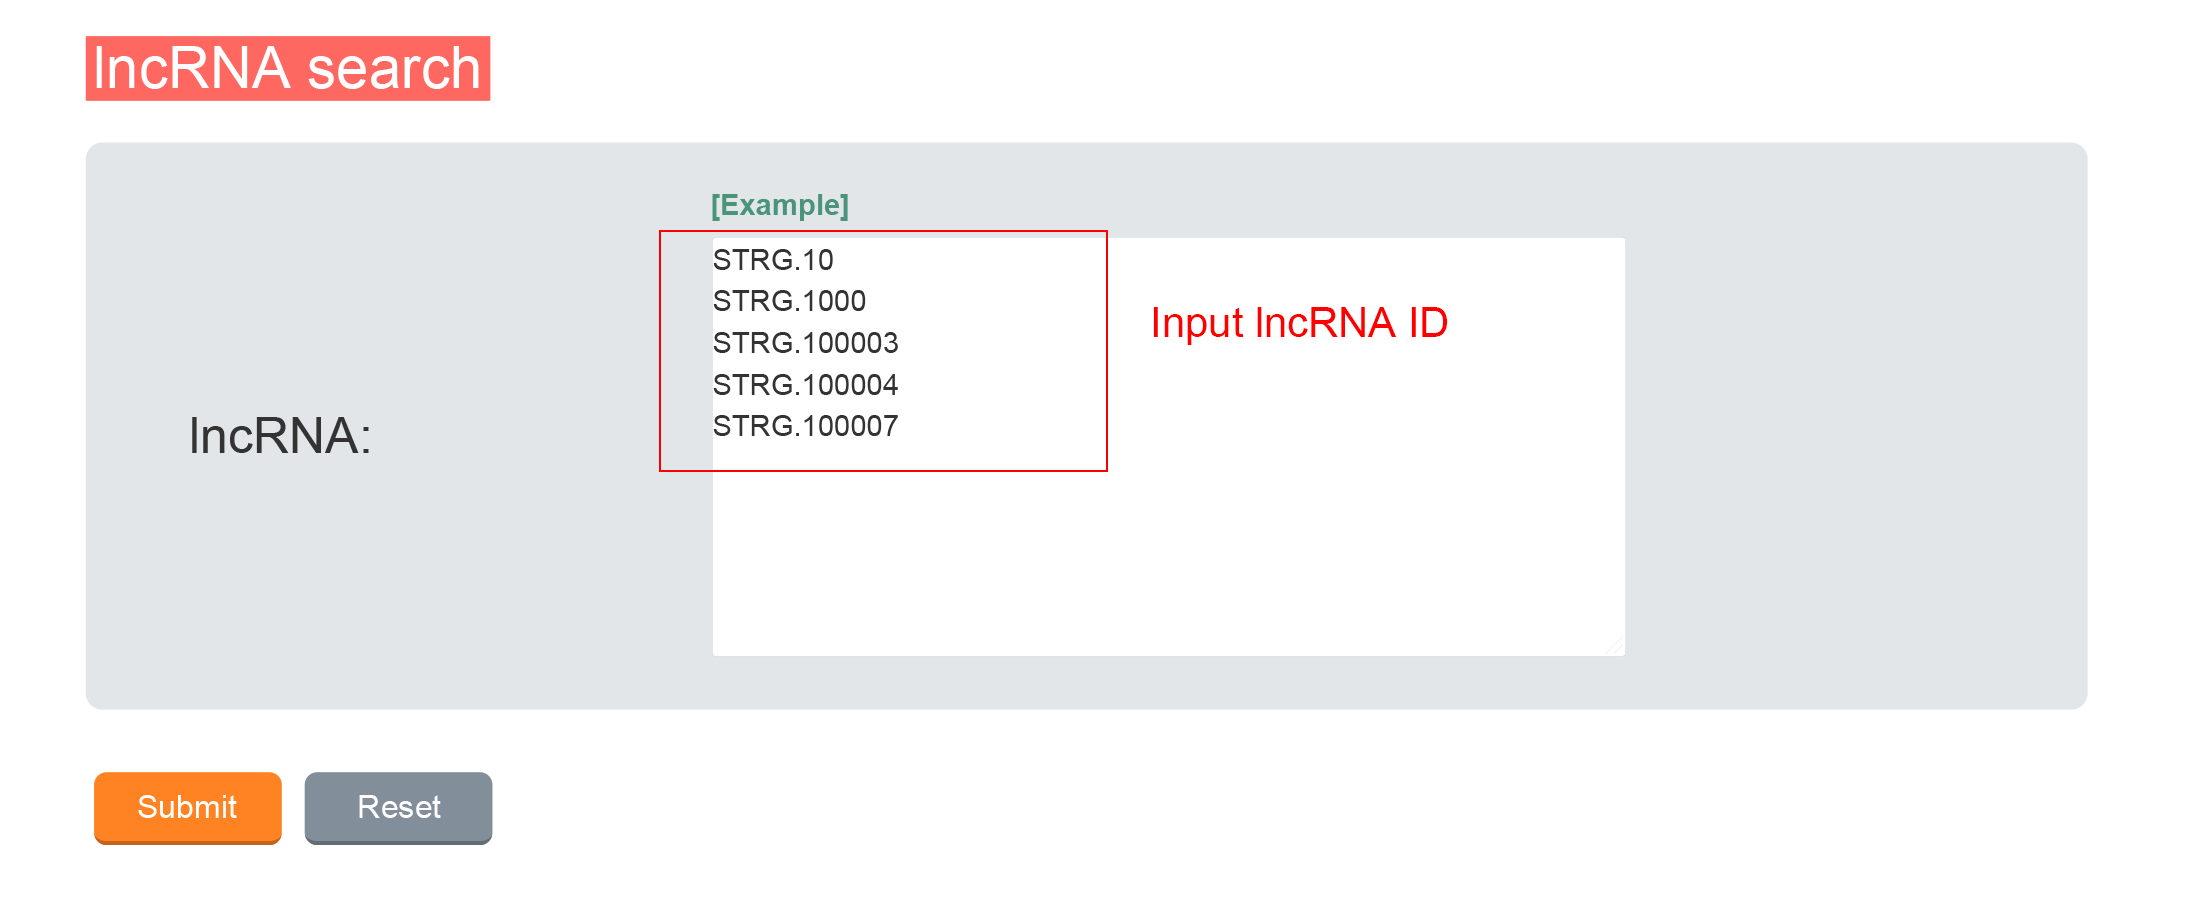
1.3 lncRNA Search
1.3.1 Data Input
1.3.2 Result
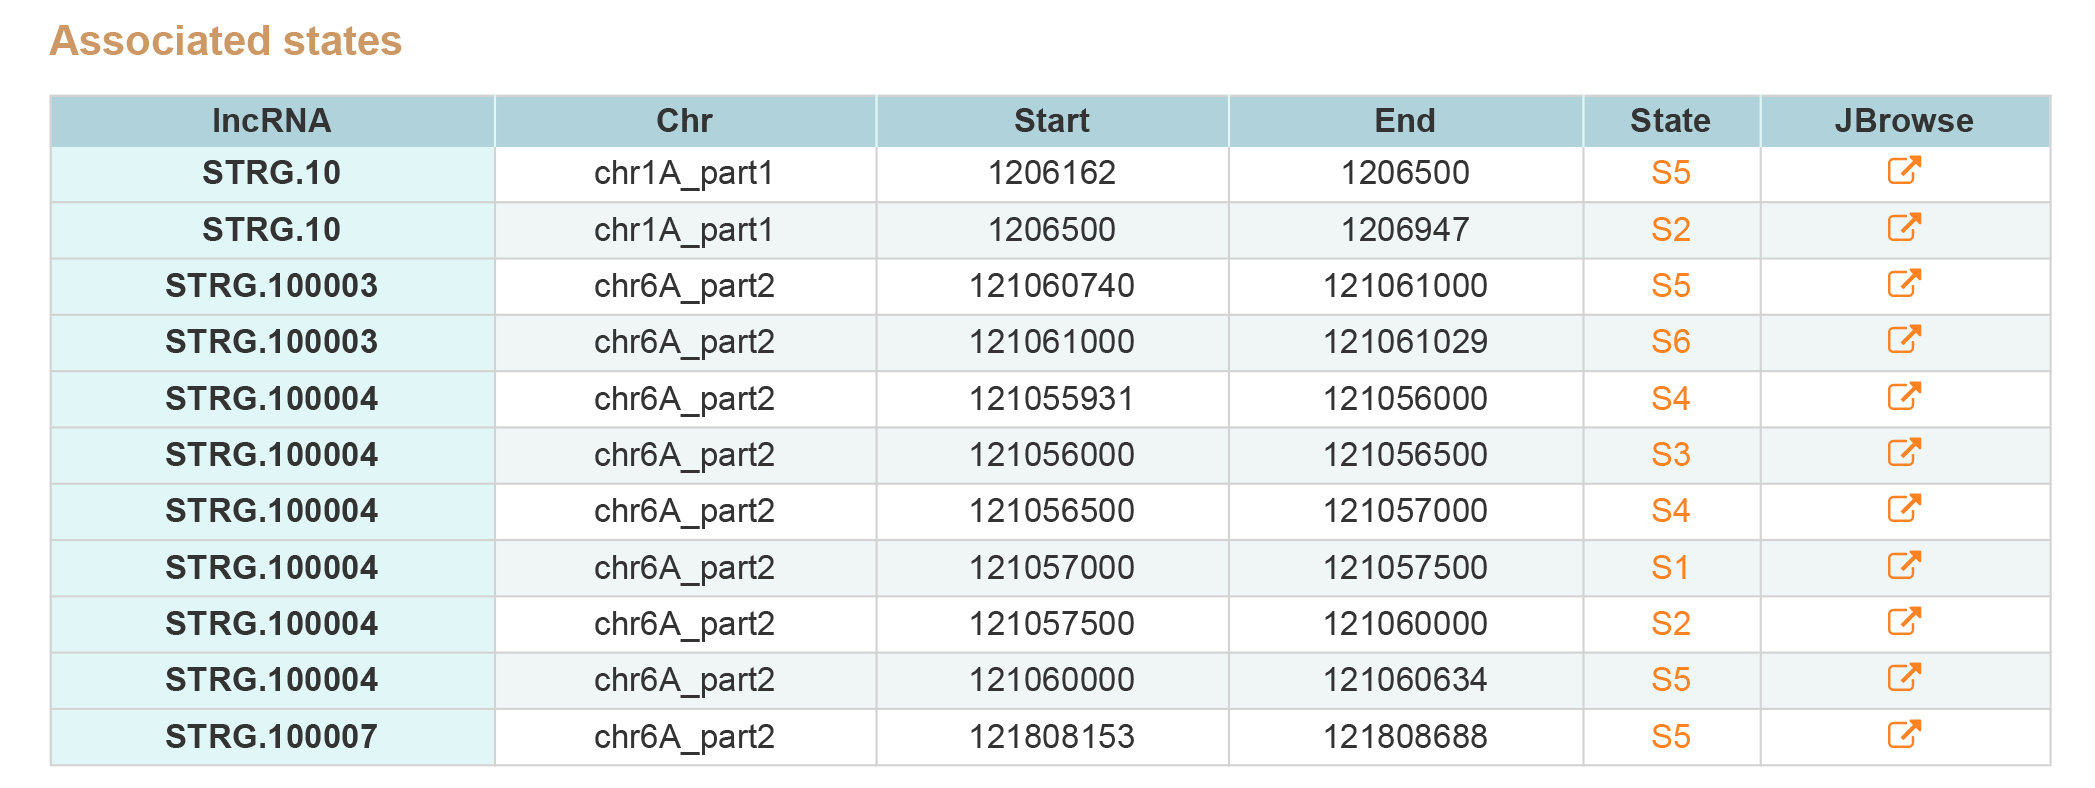
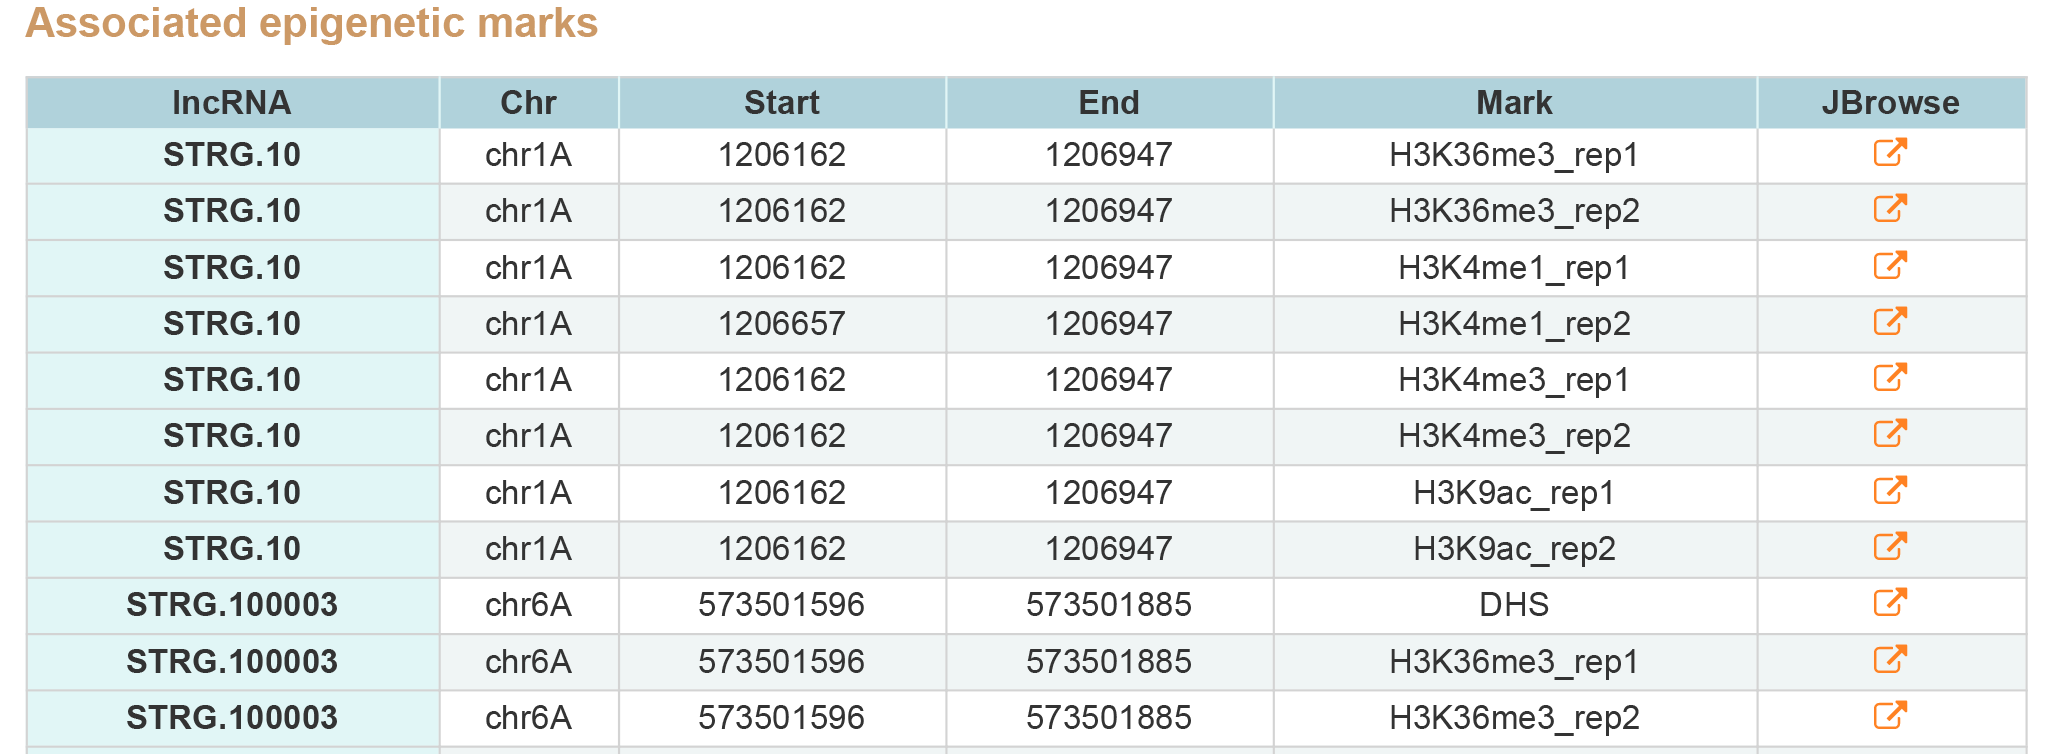
LncRNA Search contains two type of results, associated states and epigenetic marks around genes.By clicking JBrowse button view the information around lncRNA.
1. Associated states.
2. Associated epigenetic marks.
1.4 State Search
1.4.1 Choose One State
A Hidden Markov Model was applied to aggregate or collapse the multi-dimensional matrices into a small number of chromatin states. We identified 15 chromatin states located in 1,714,604 segments across the whole genome and different chromatin states contained different epigenetic features.

1.4.2 Result
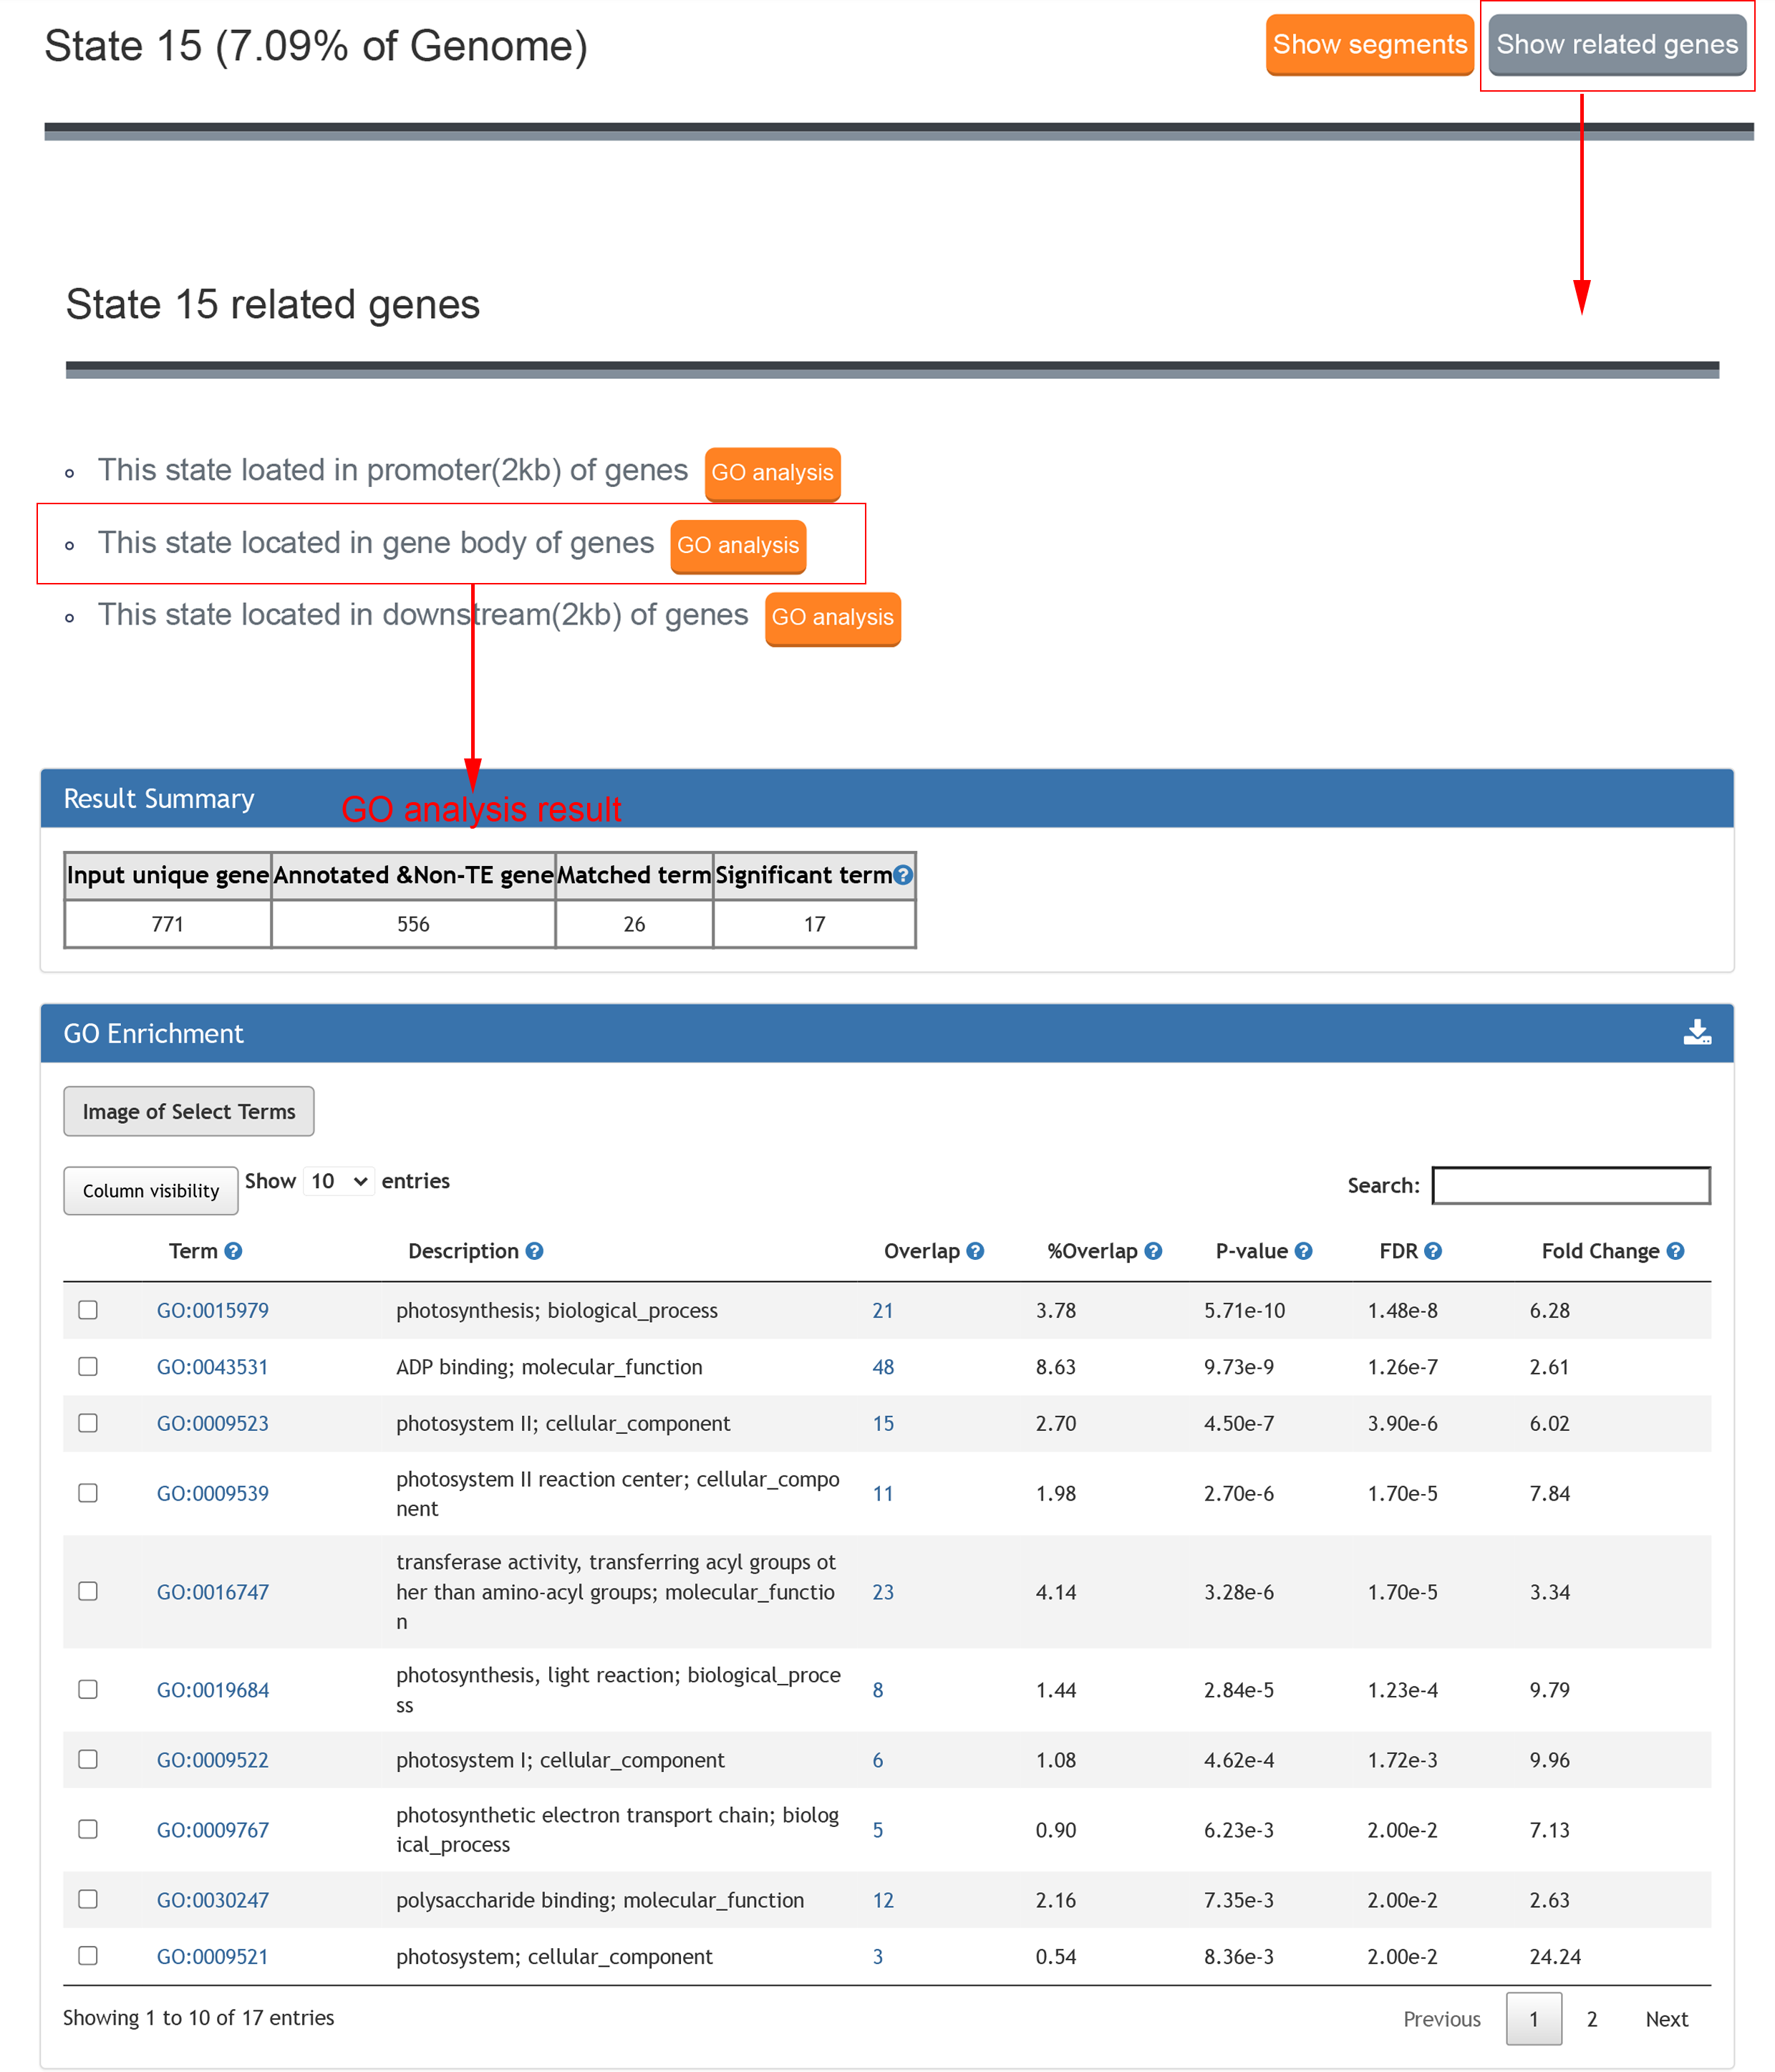
State search is for searching the features of chromatin states,the result contains the proportion in the genome, fold enrichment of the genomic regions, fold enrichment for transposable element and emission parameters of different epigenetic marks in this state.
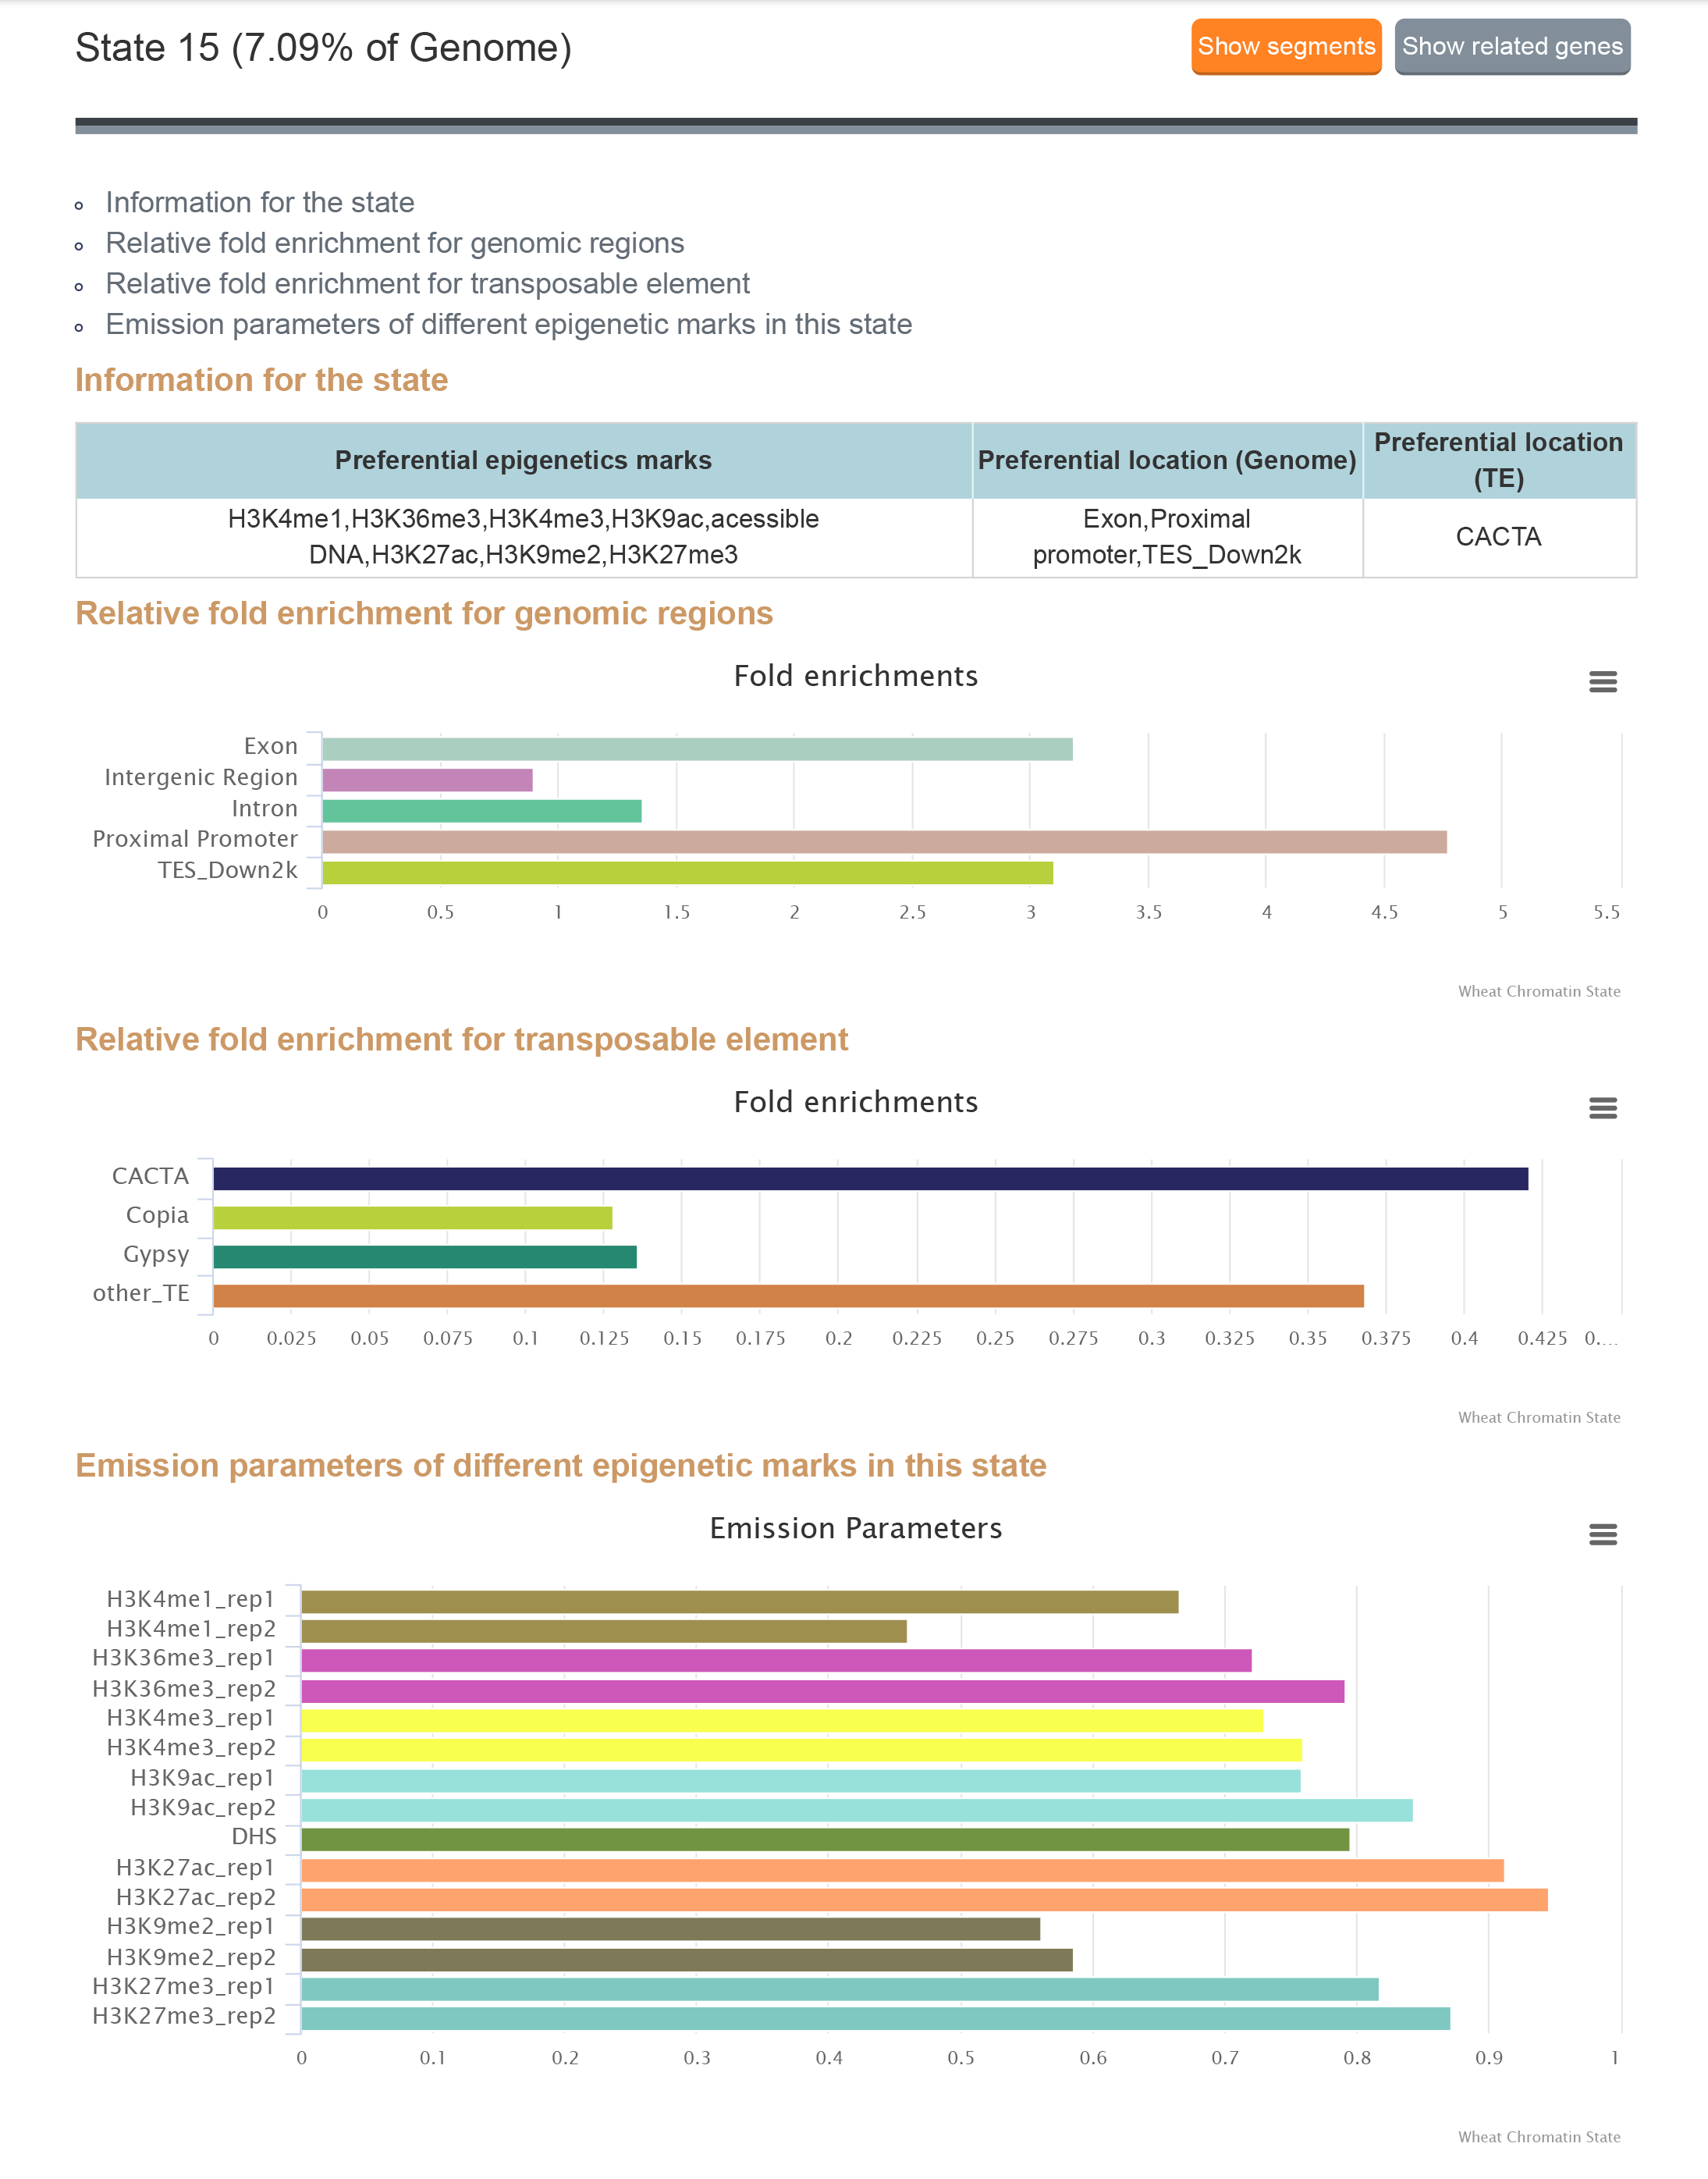
Click "Show related genes" button to see the related genes of each state and click "GO analysis" button to analyse the enriched GO term of these genes. GO analysis links to Plant Regulomics to analyse the enriched GO term of these genes
1.5 Epigenetic Data Search
1.4.1 Choose Epigenetic marks type
15 Wheat epigenomic datasets, including ChIP-seq, DNase-seq.
1.4.2 Result
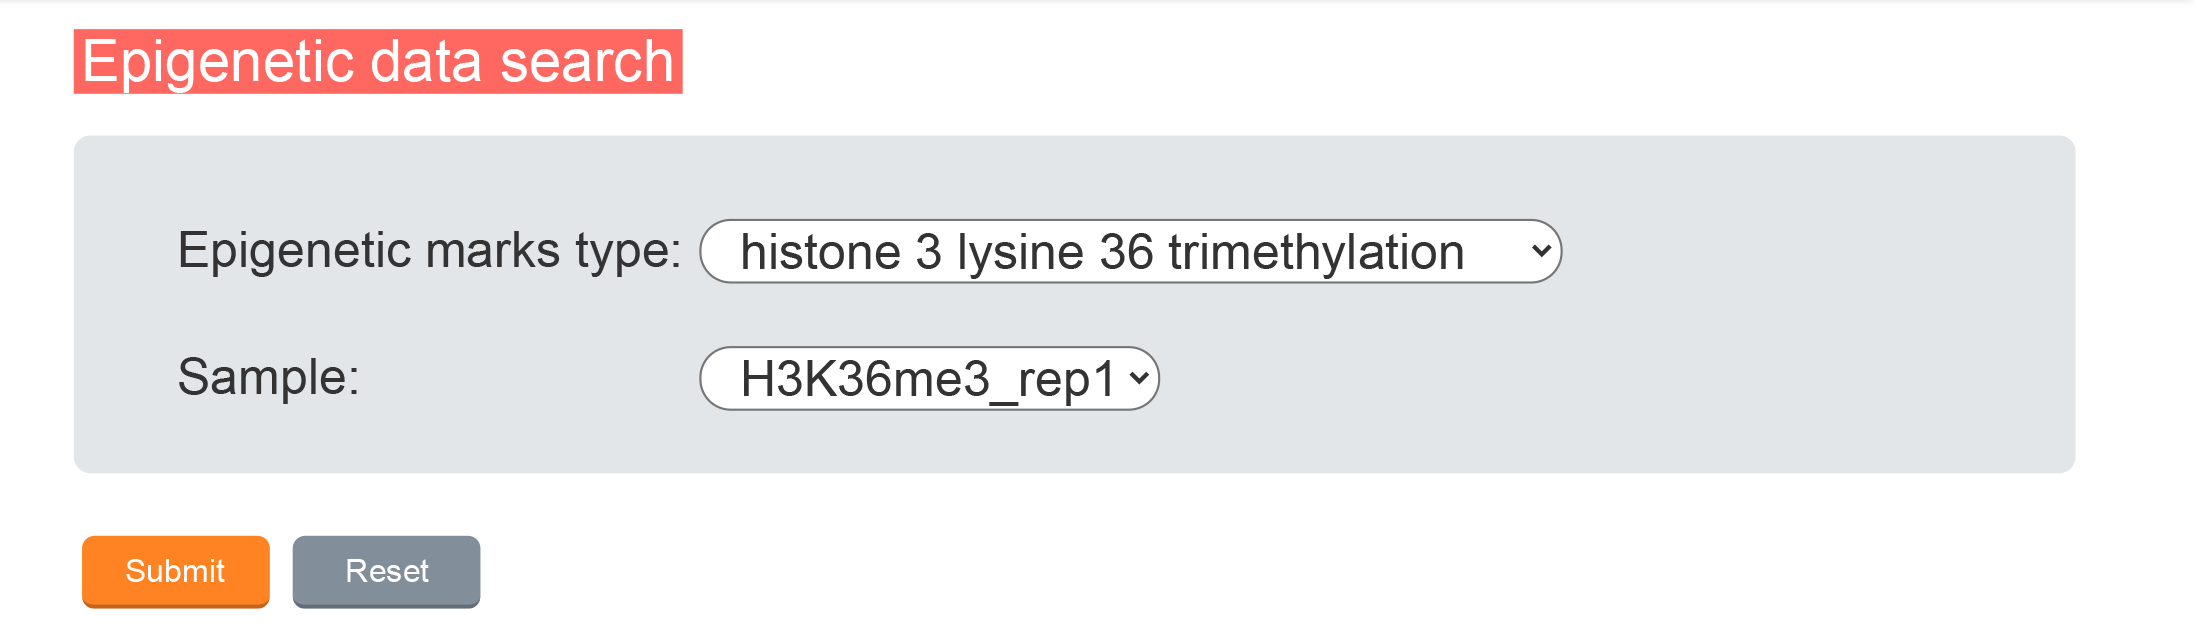
Epigenetic Dataresult contains the sample information and source, emission in states, distribution in genome and distribution around genes.Click the "Related genes" button to show the epigenetic mark related genes.

1.5 SOM Search
1.4.1 Choose Epigenetic marks type
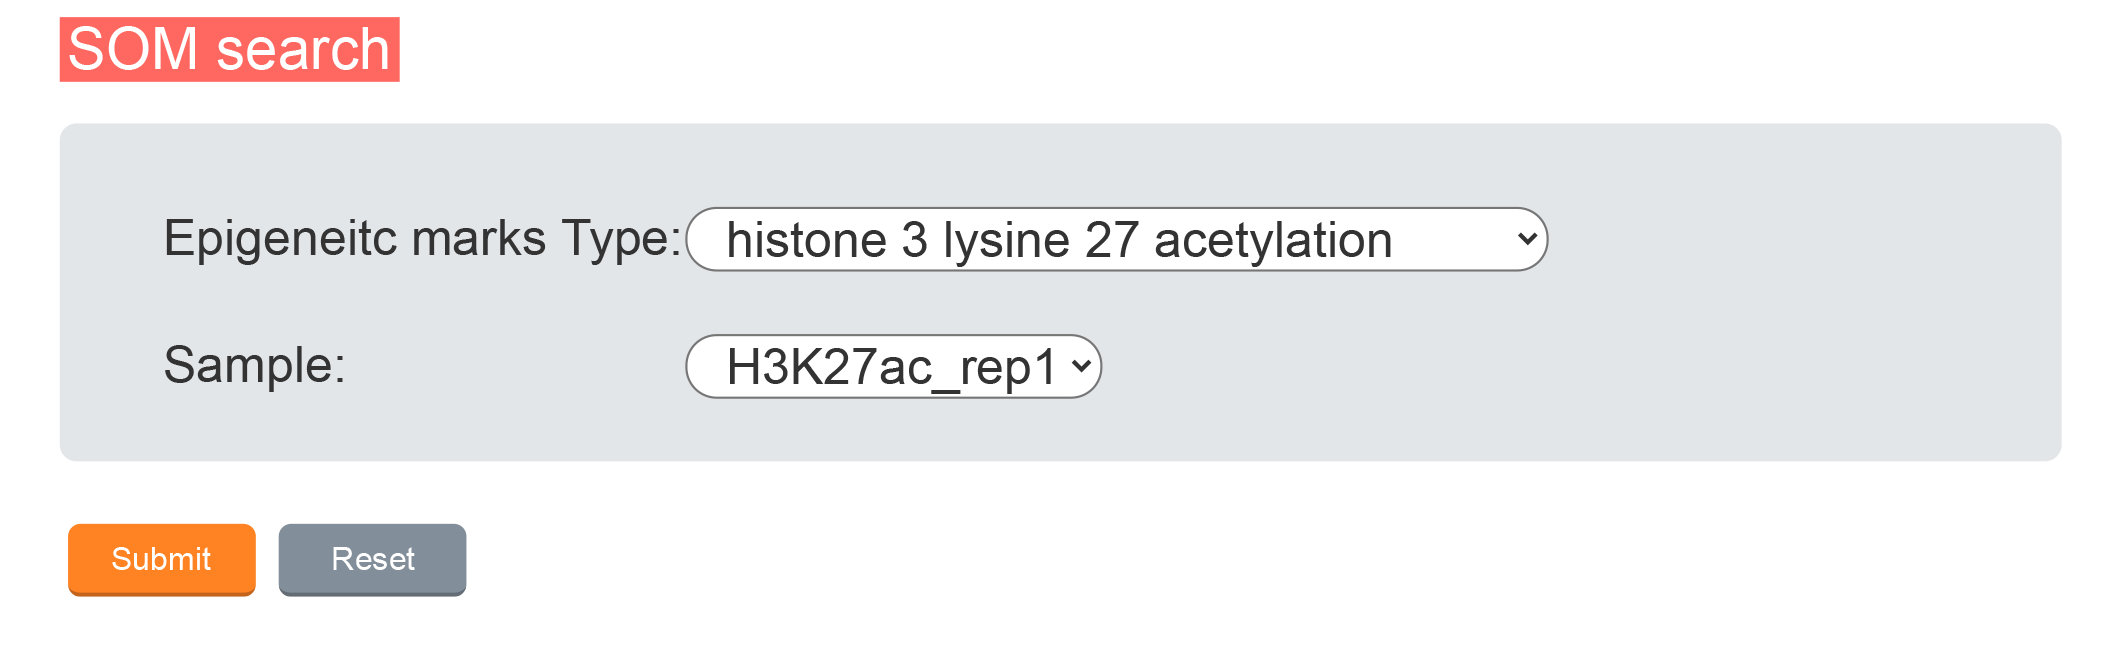
SOM search can provide the SOM map of the epigenetic marks.
1.4.2 Result
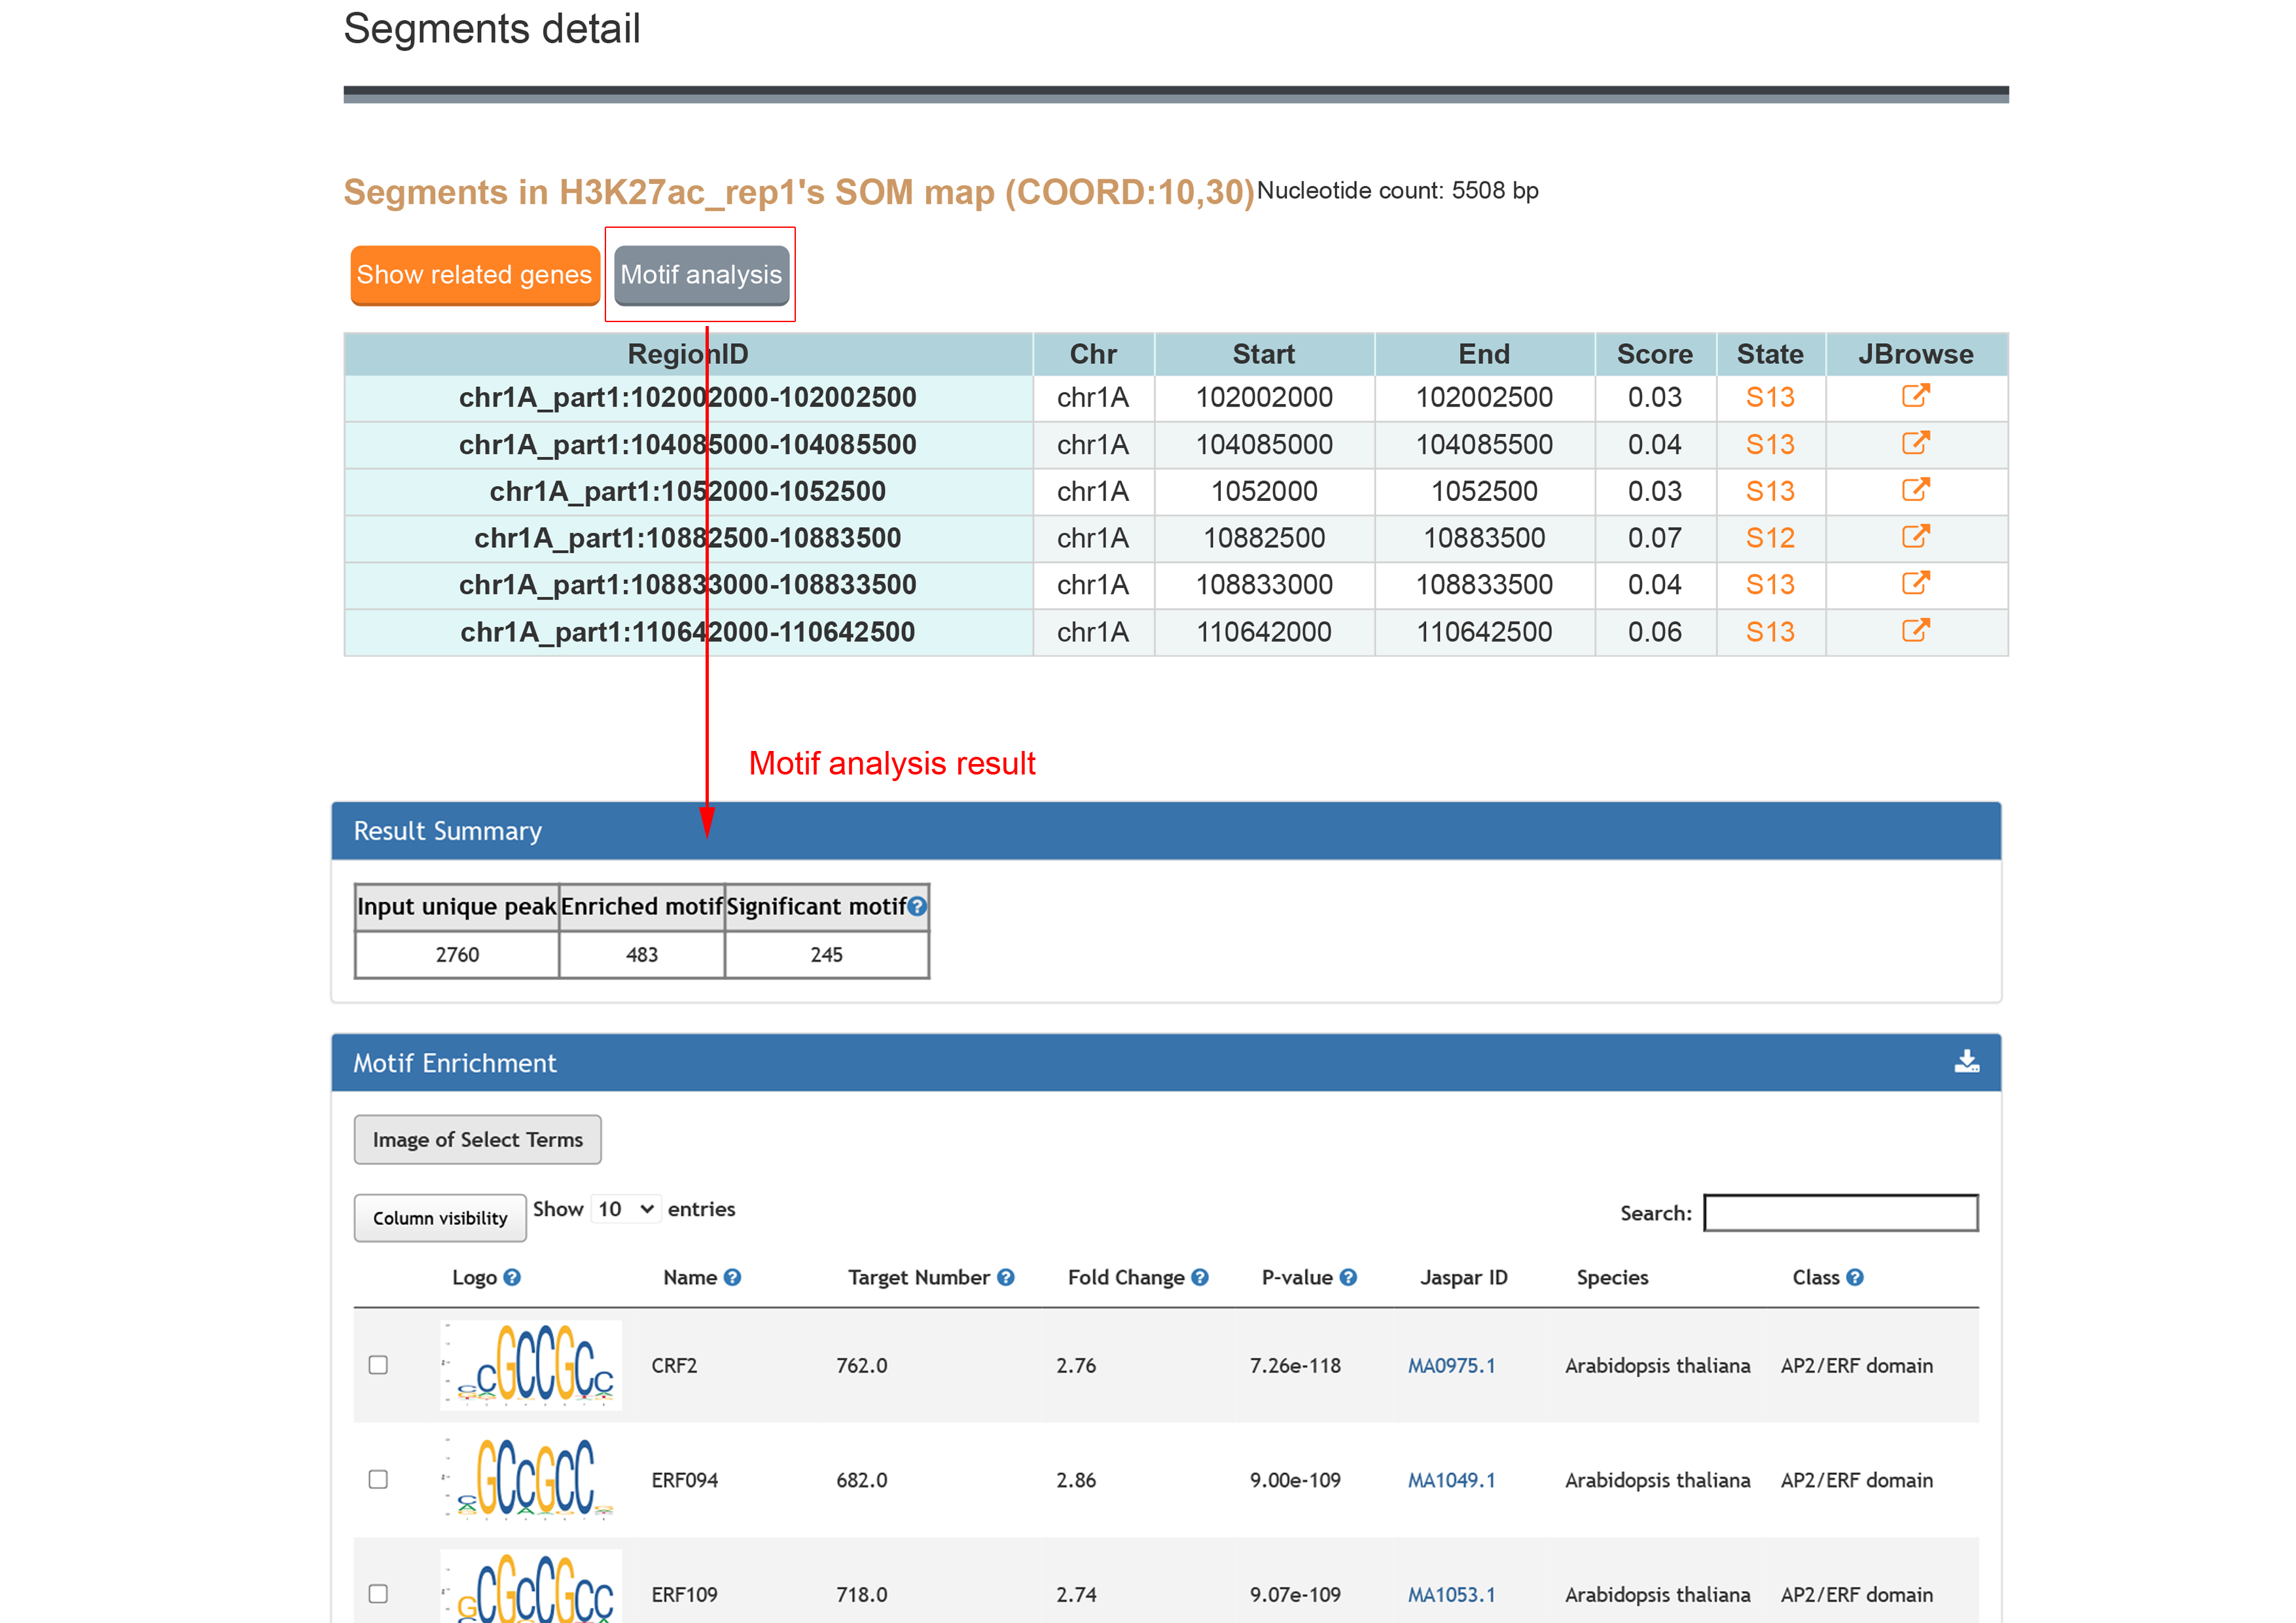
The result contains the SOM map for the searched epigenetic mark. The heatmap shows the score of the each unit. Click the score to see the segments and related genes of the unit.
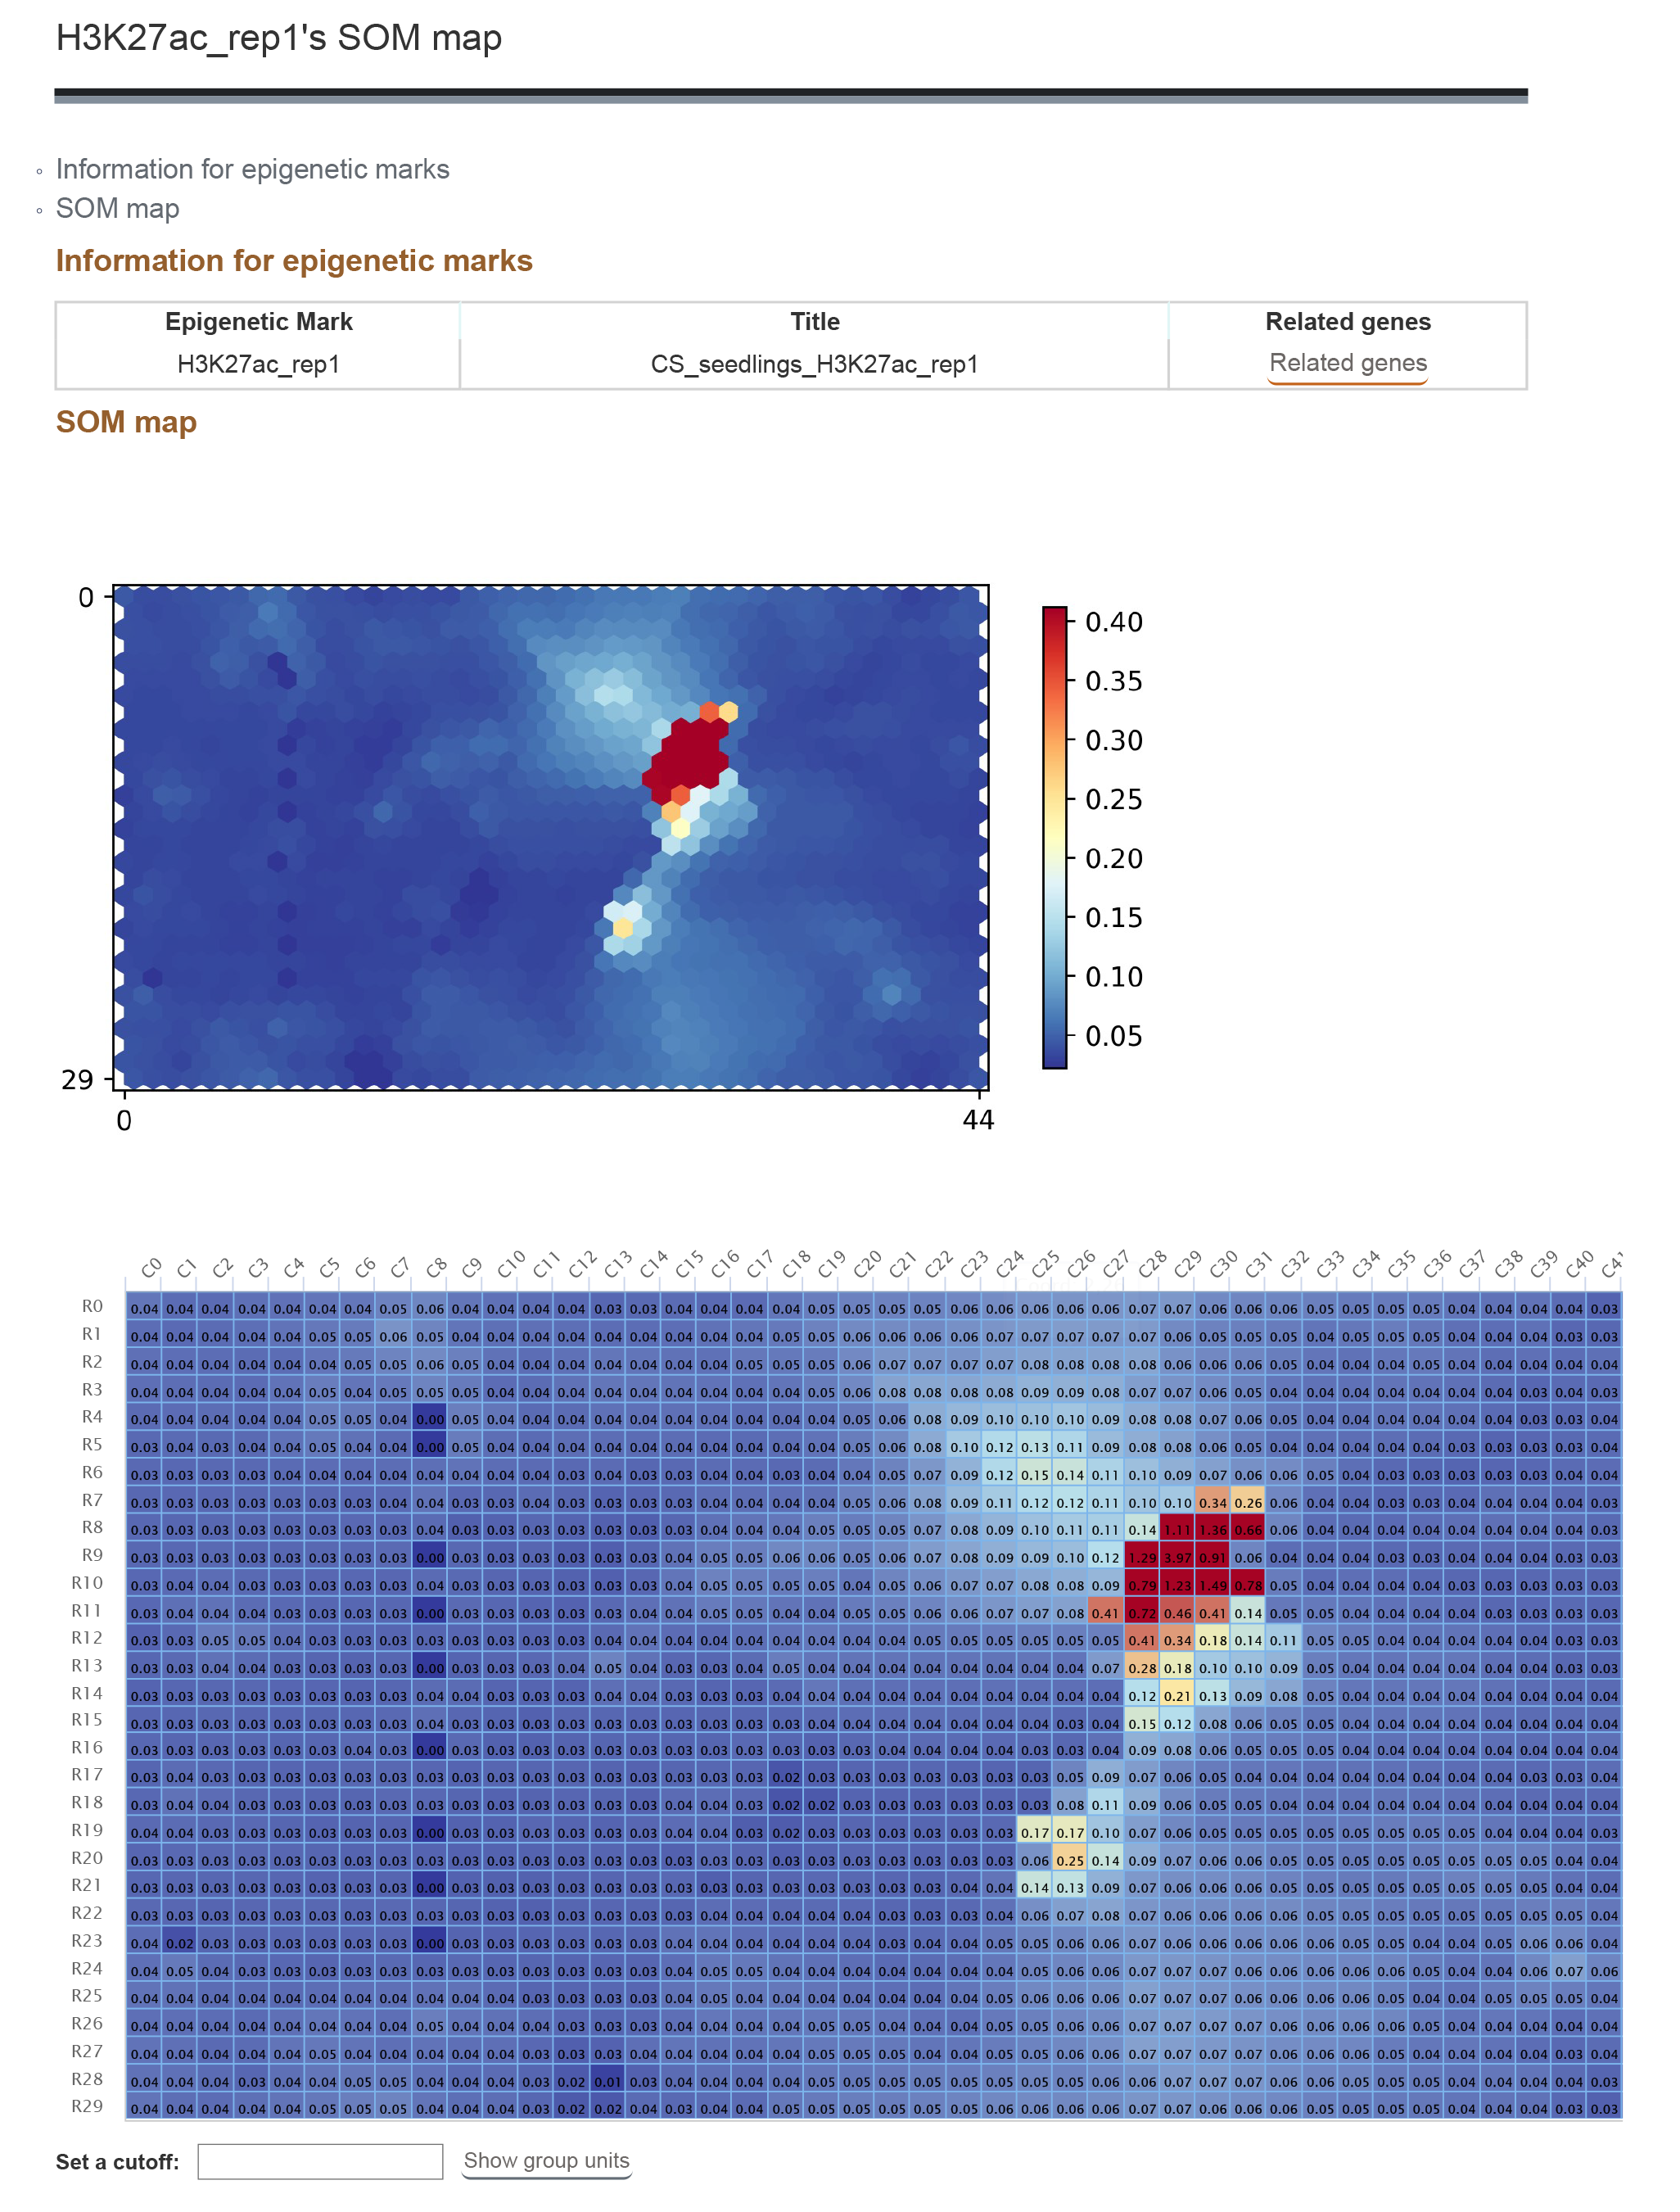
The segments detail information and click "Motif analysis" button to do motif enrichment for these regions.
2 Tools
Some analysis tools for new epigenomic data sets based on chromatin state information
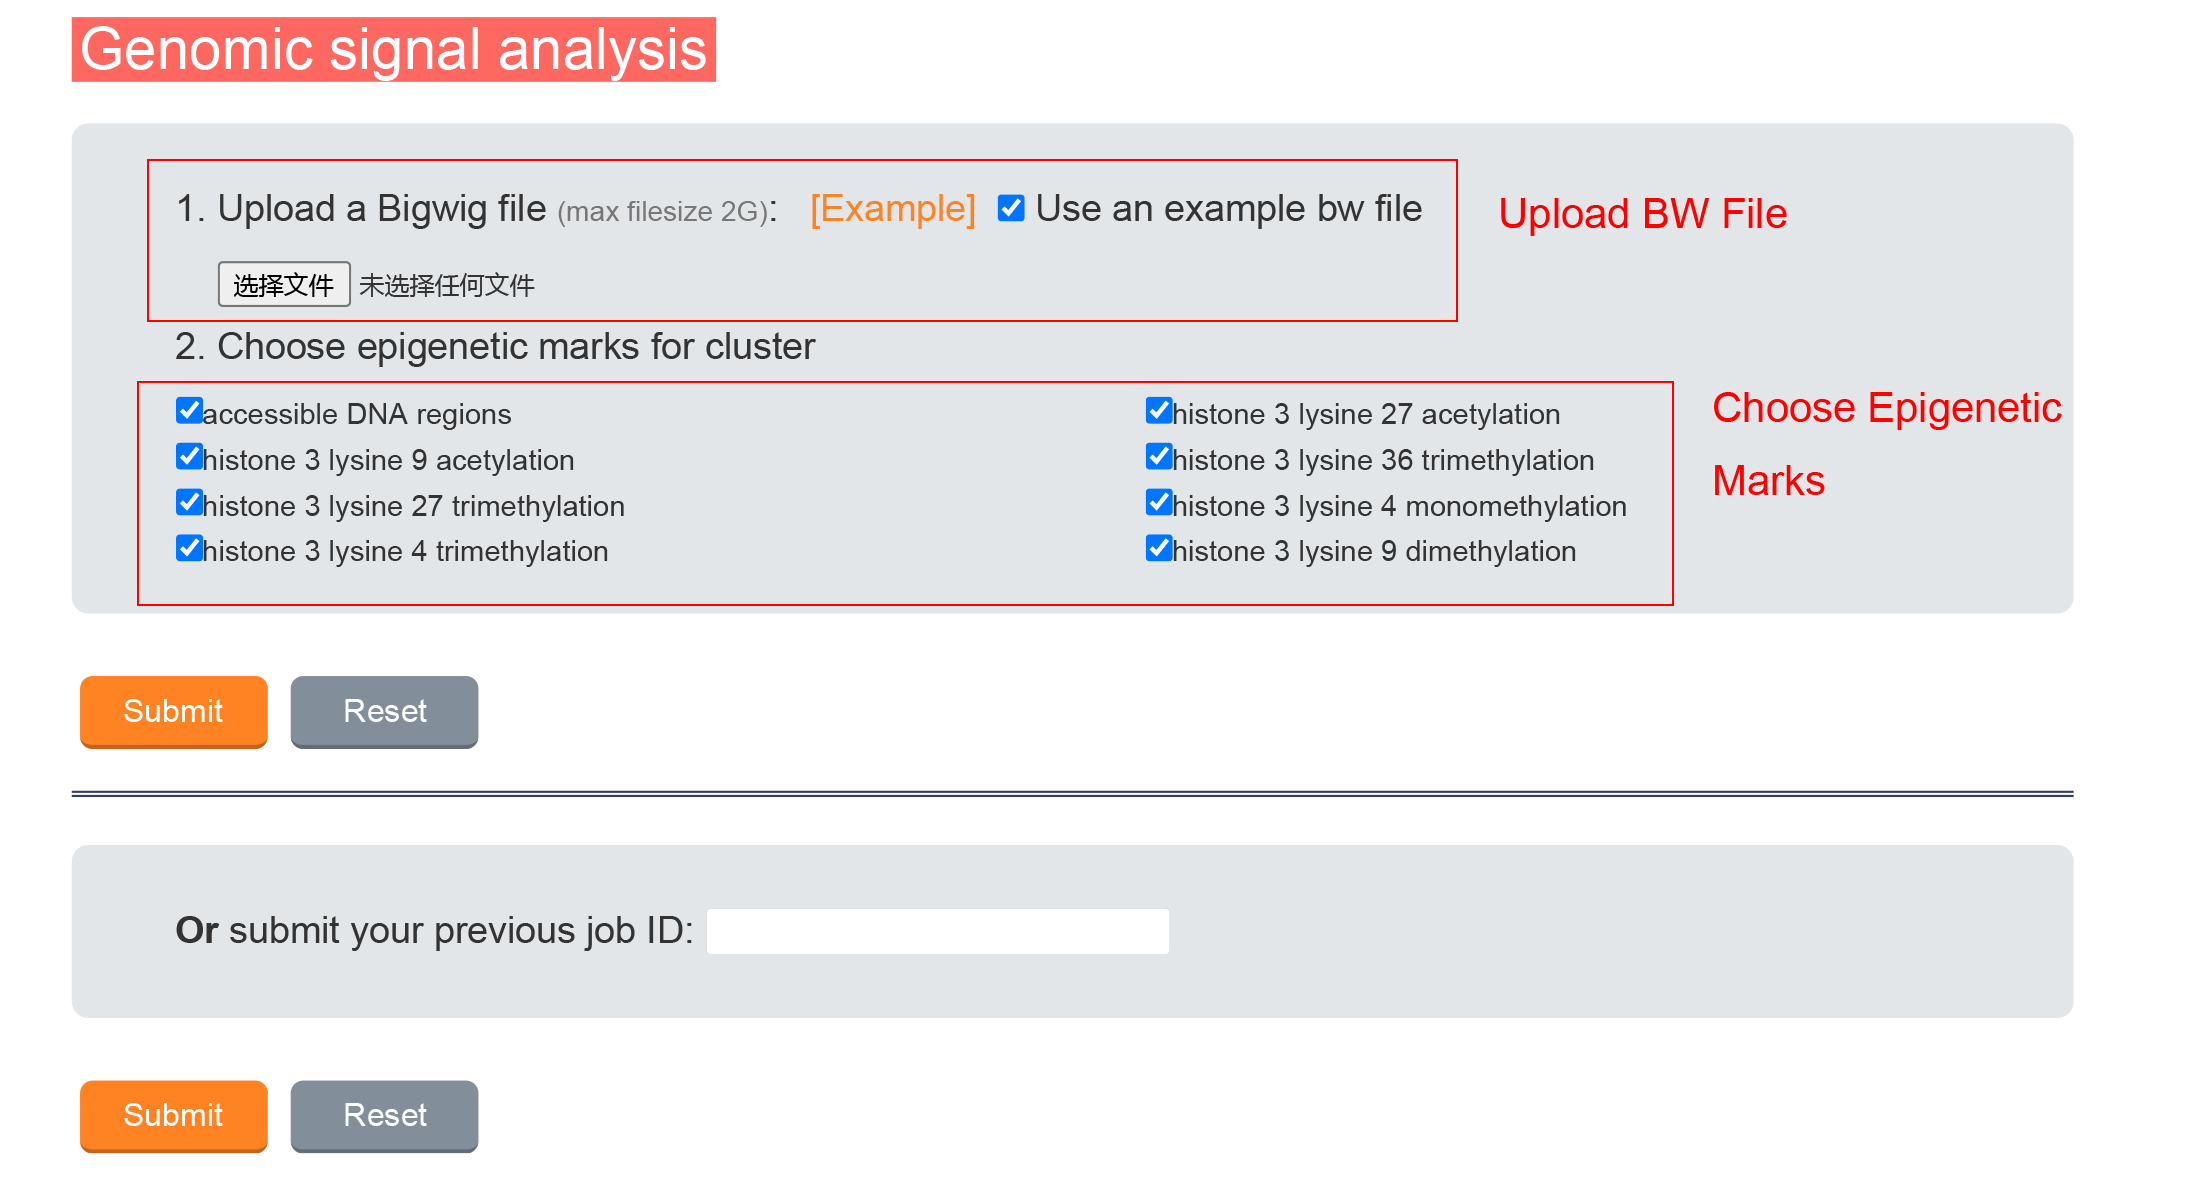
2.1 Genomic signal analysis
BW file is needed, the average signal in each state and the correlation with database data will be calculated.
2.1.1 Data Input
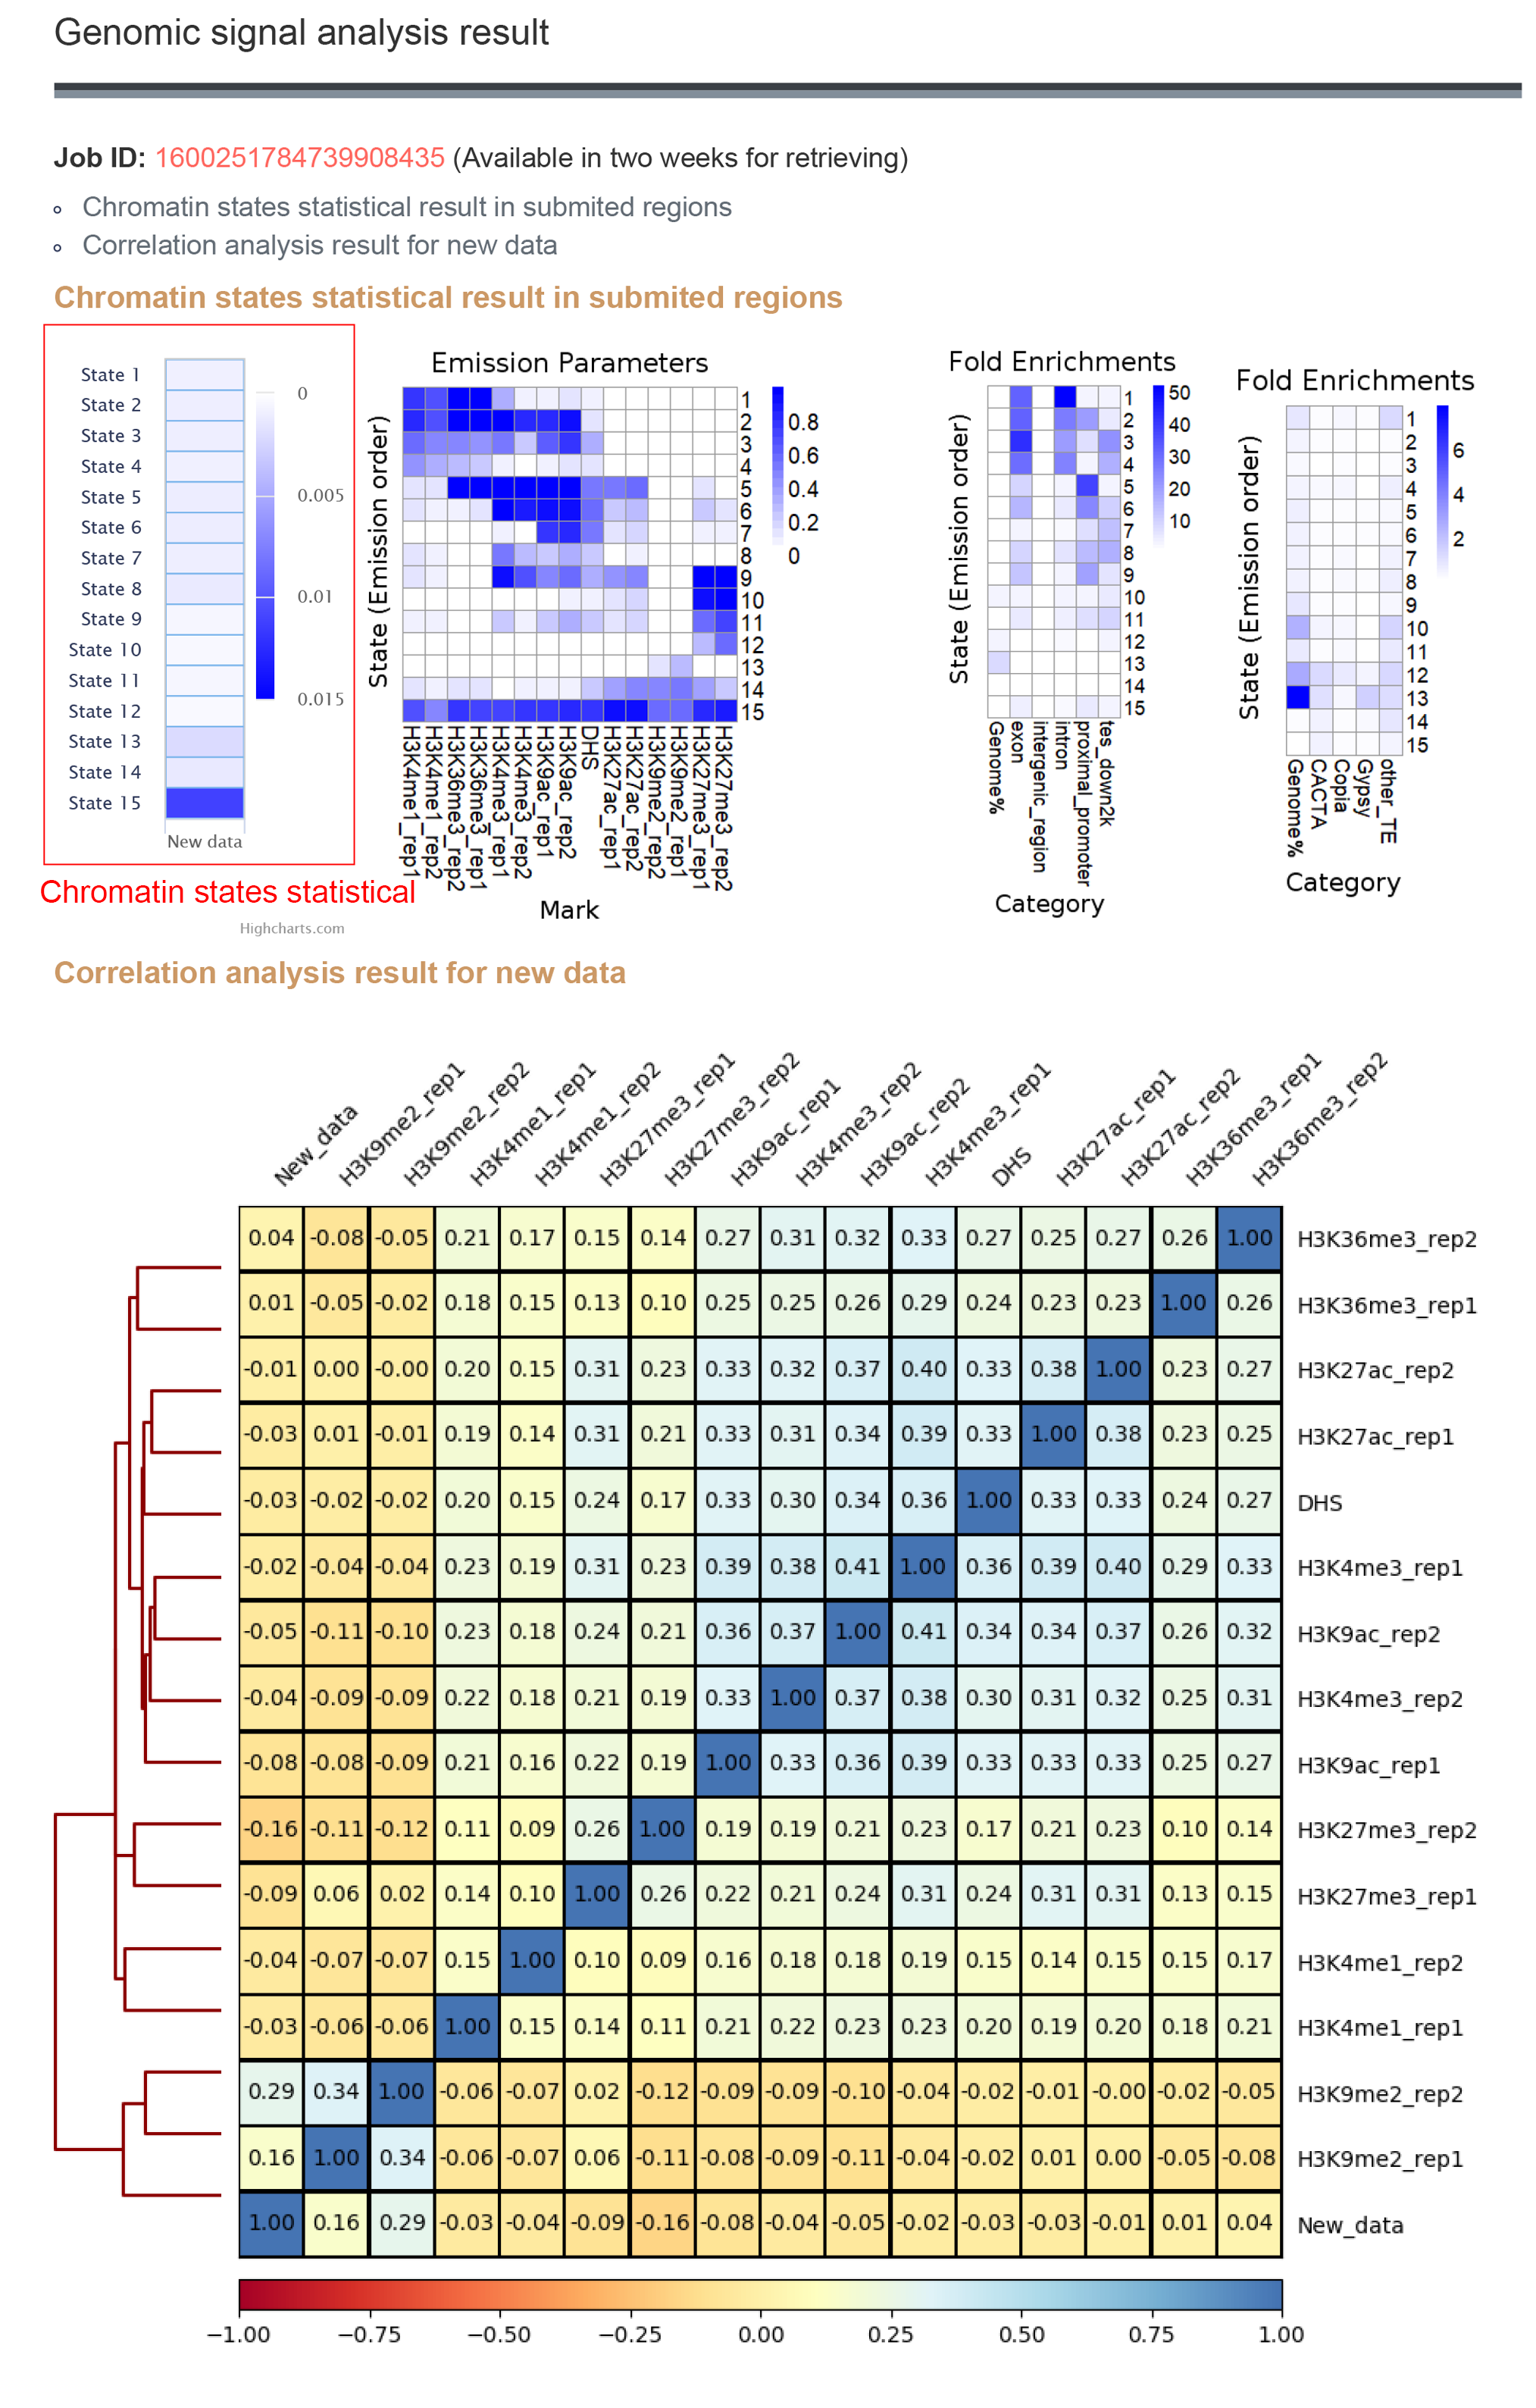
2.1.2 Result
The results contains the average signal in each state of the new data and the correlation with database data
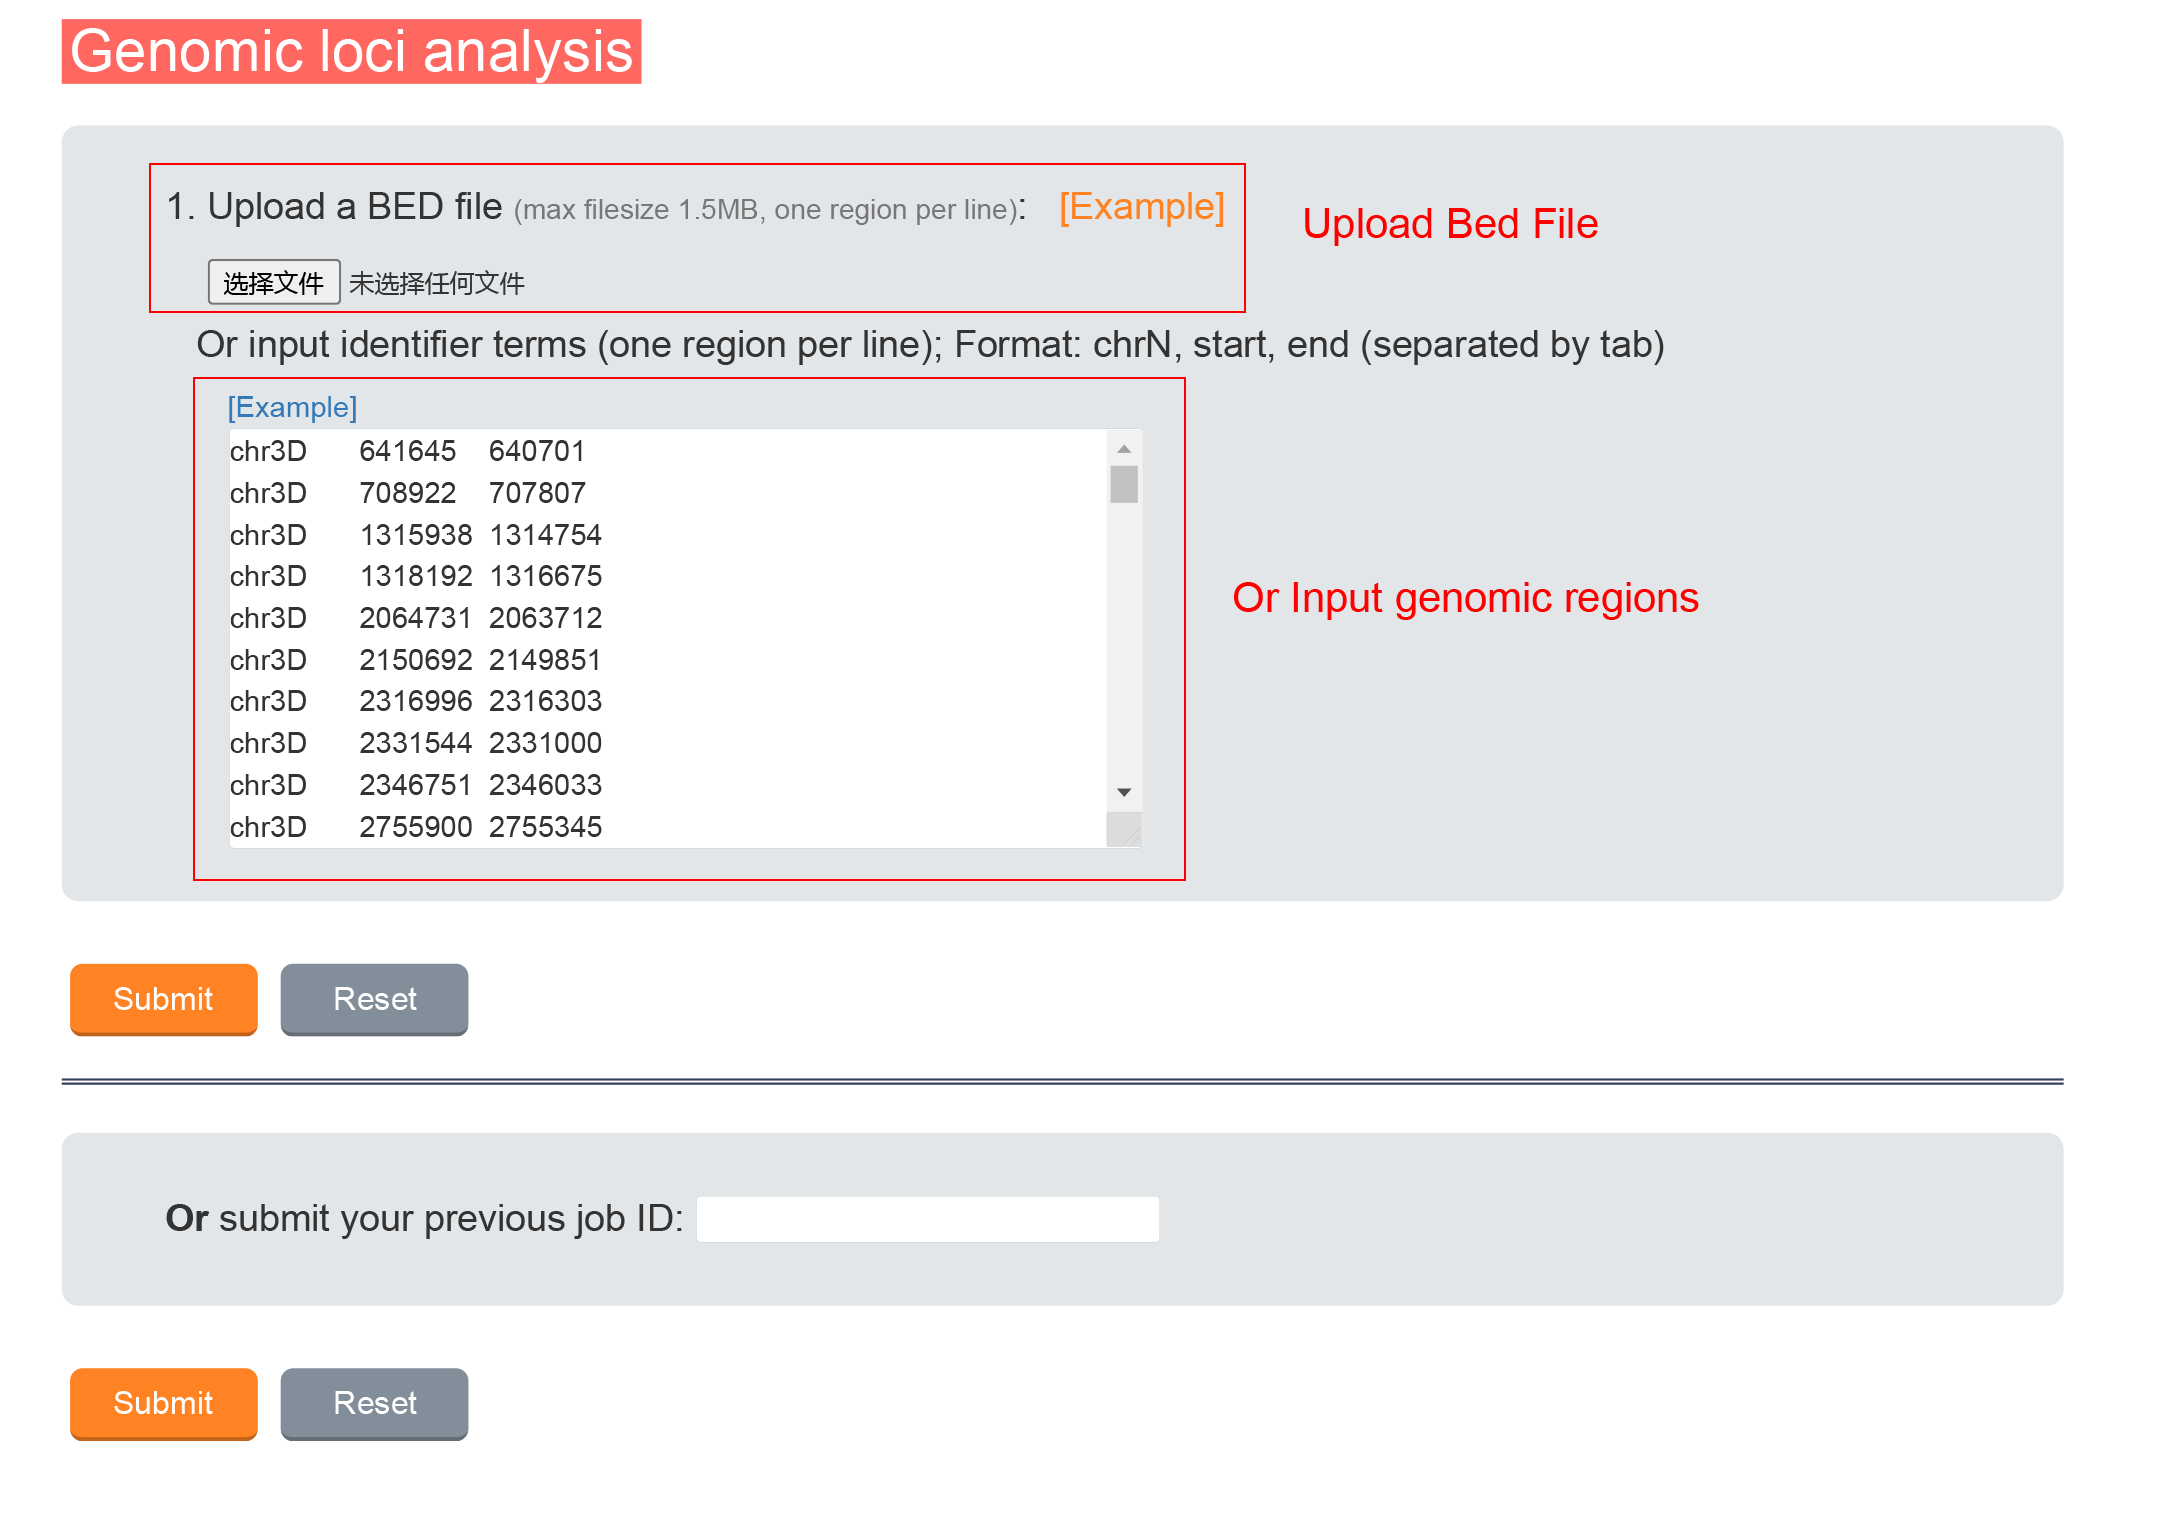
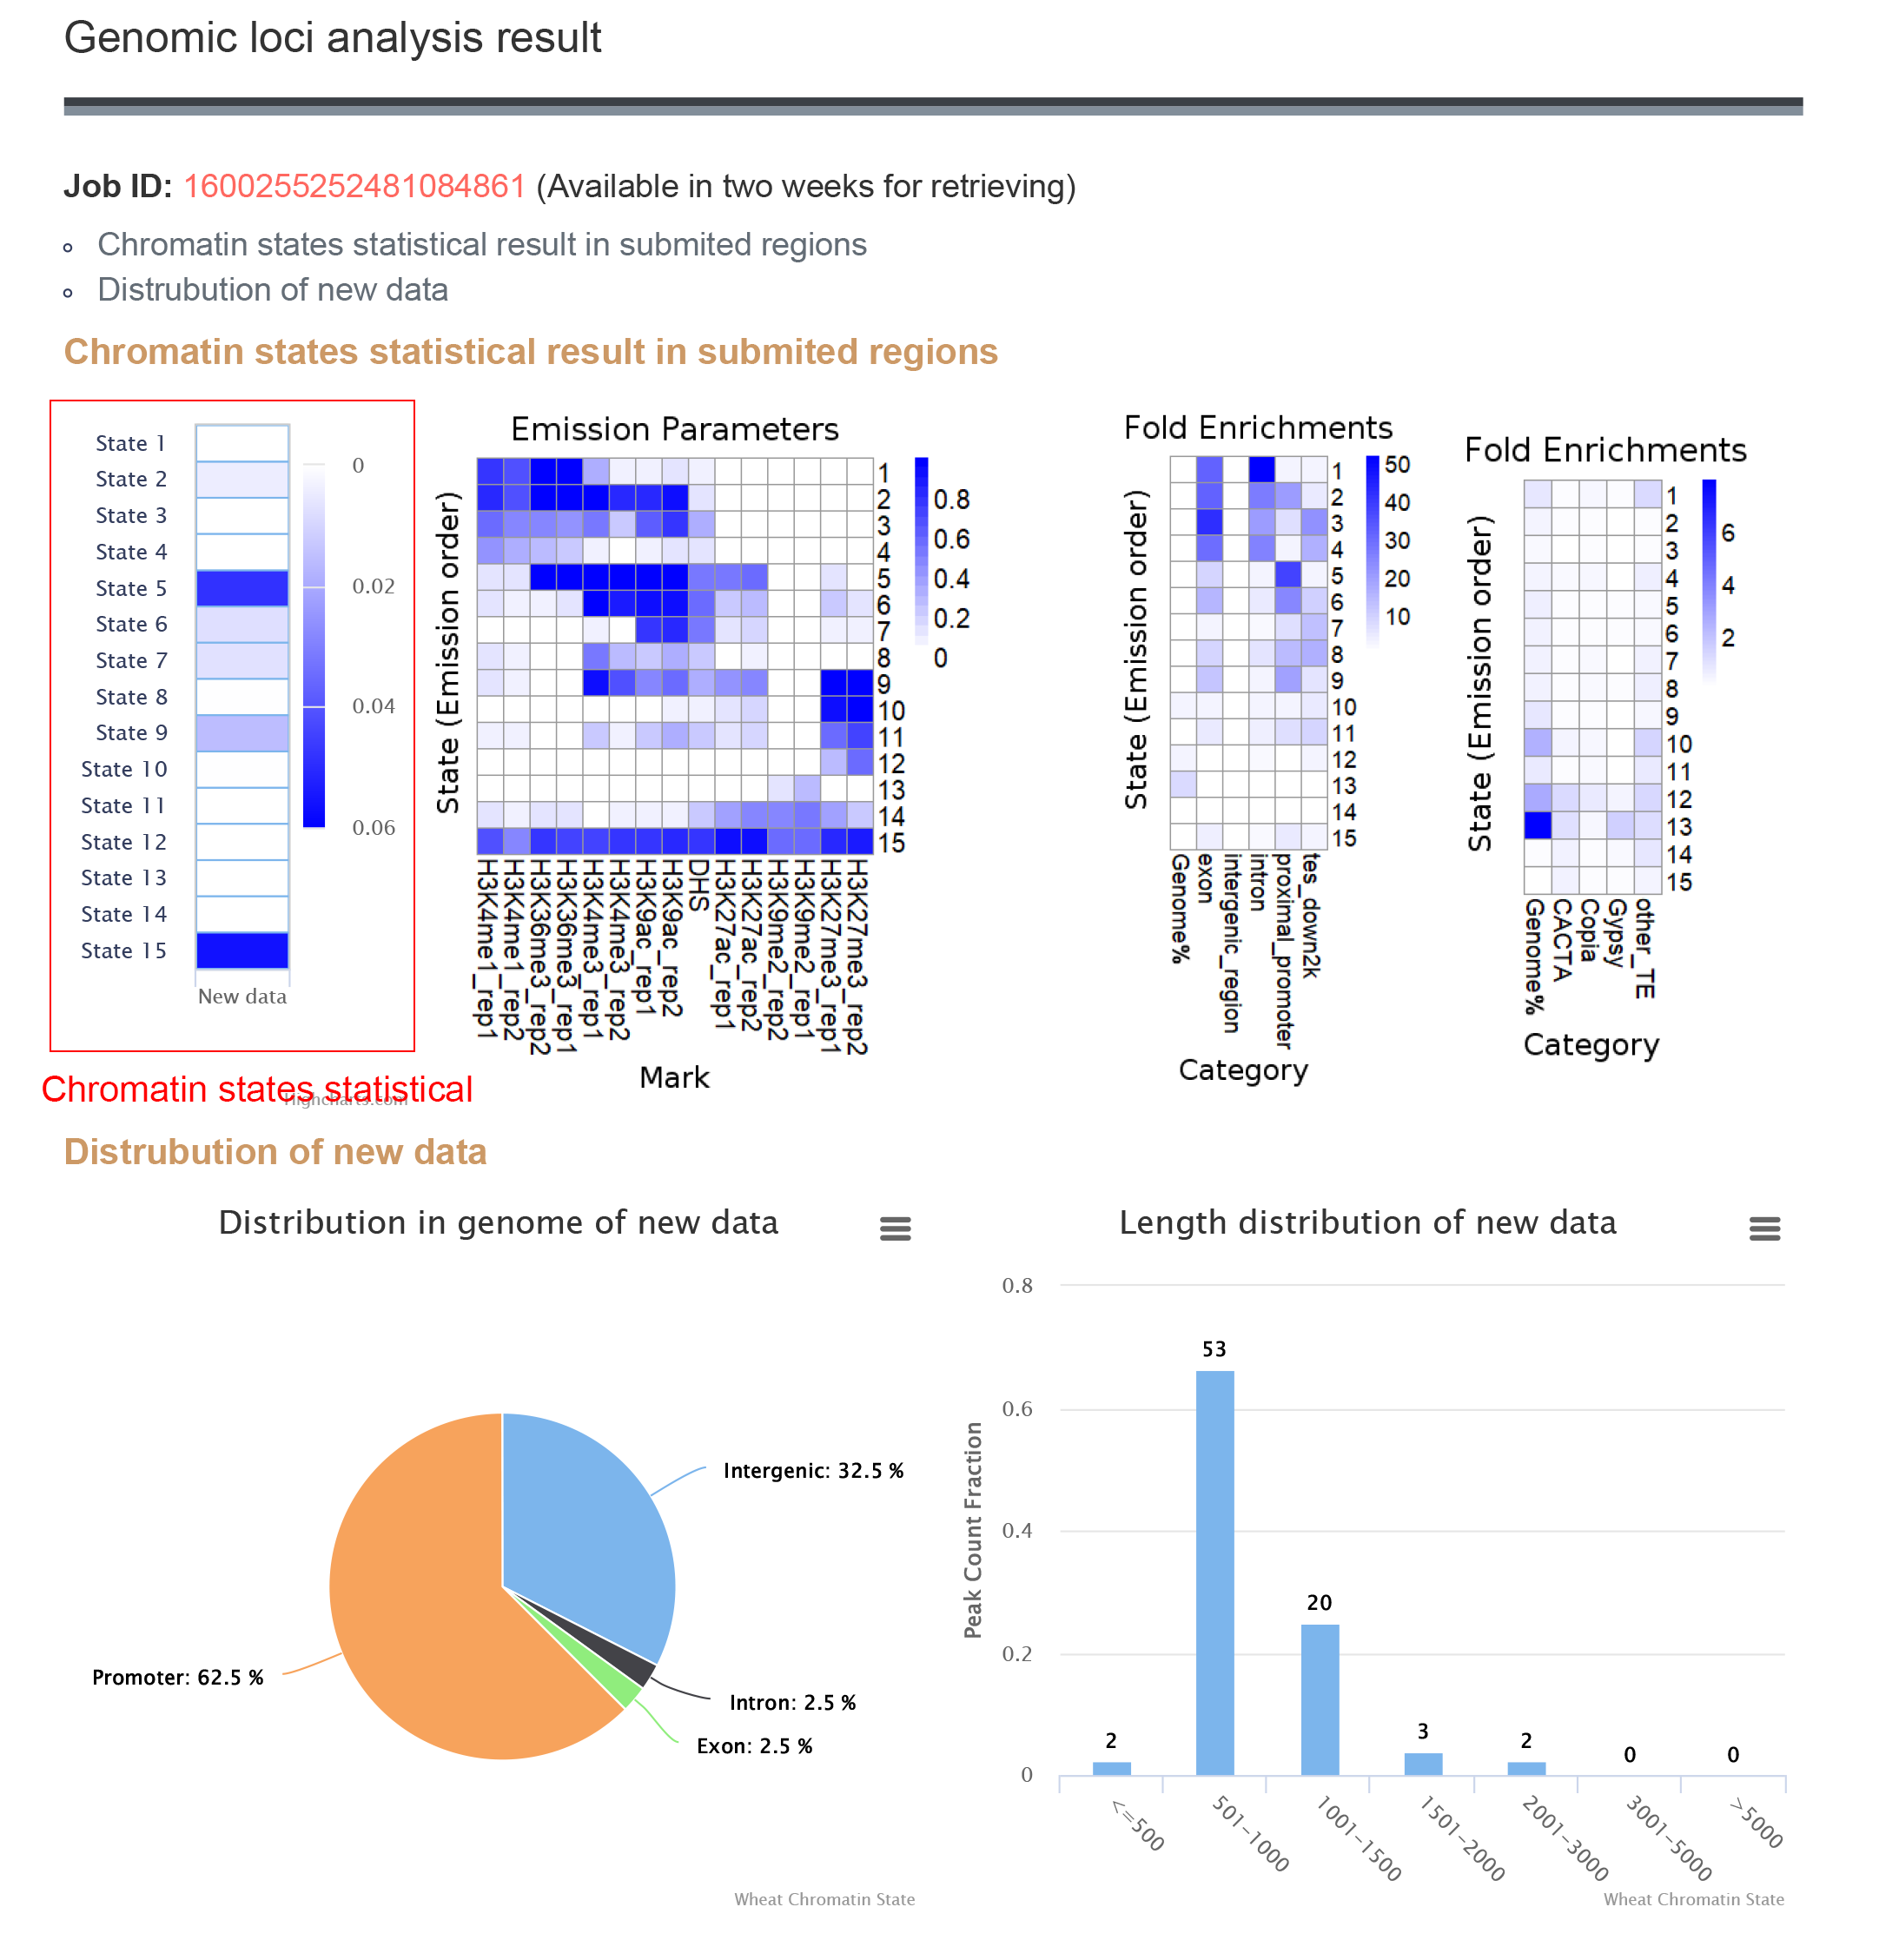
2.2 Genomic loci analysis
Upload Bed file or input functional genomic regions , the number of genomic regions in each state and the genomic regions distribution will be calculated.
2.2.1 Data Input
2.2.2 Result
The results contains the chromatin states statiscal in submited regions and the distribution of these regions.
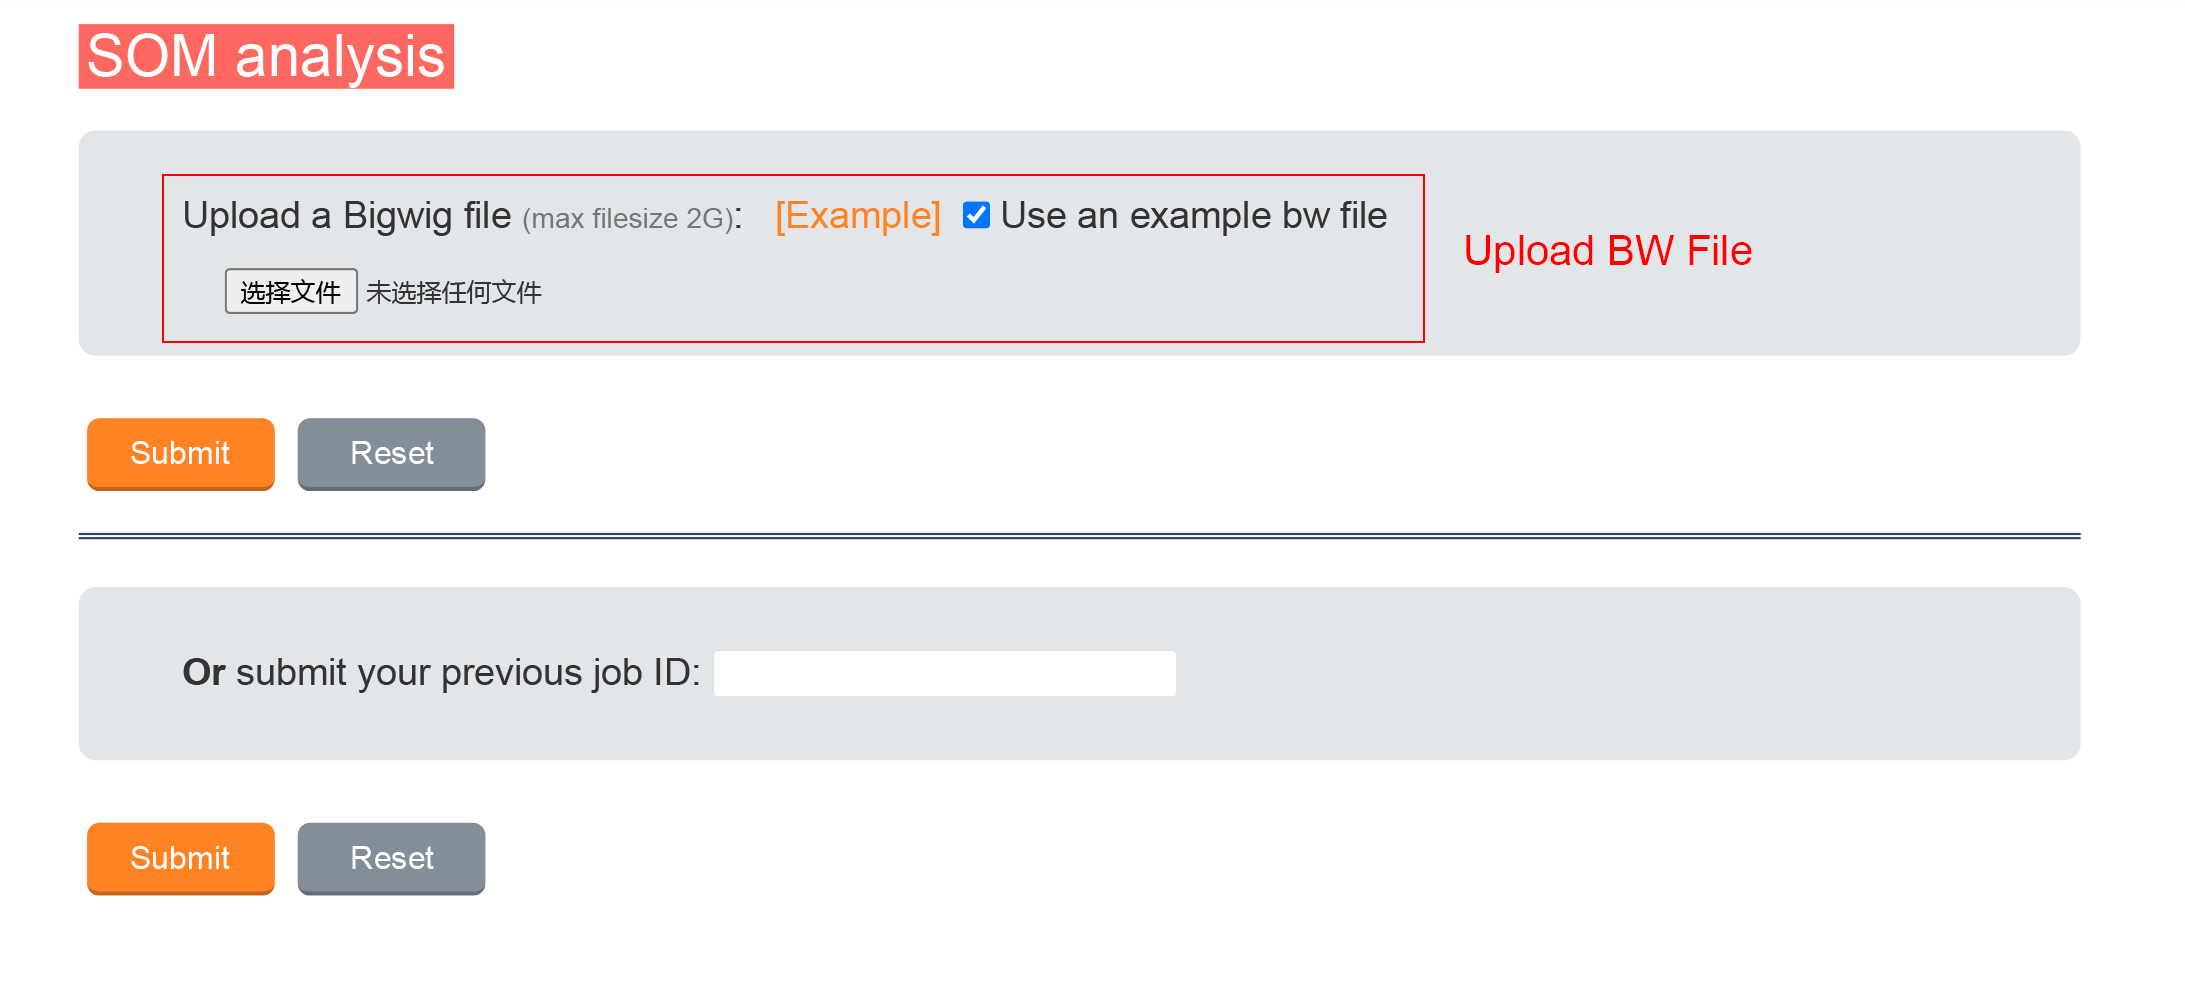
2.3 SOM analysis
Upload BW file, the BW file will be mapped to trained SOM map and high signals units will be showed.
2.3.1 Data Input
2.3.2 Result